
Fig. S4
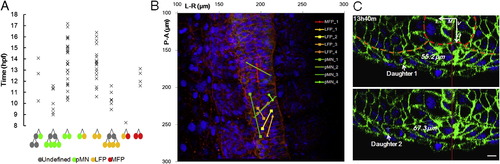
Positional Separation and Mixing of Sister Cells, Related to Figure 4 (A) Distribution of divisions in time by division types. 66 out of 83 divisions from Figure 4A are plotted (accurate times of some divisions were not recorded thus were not included). Divisions giving rise to pMNs and LFPs spread out along the same time window but a division giving rise to one pMN and one LFP was not found. (B) Separation of sister cells. Image is a 3D projection of the original data set at 16.9hpf, lines connect positions of sister cells. Due to different Z depth, the cells under the marks may not be the actual tracked cells, which might lie deeper below. A lot of sister cell pairs are separated by the midline, pMN_1 sister pair is separated into different neural segments. (C) Example of divisions that render one daughter closer to notochord than the other. Images are cross-section slices rendered and measured in GoFigure 2. Red line: midline. Scale bar: 10 μm. |
Reprinted from Cell, 153(3), Xiong, F., Tentner, A.R., Huang, P., Gelas, A., Mosaliganti, K.R., Souhait, L., Rannou, N., Swinburne, I.A., Obholzer, N.D., Cowgill, P.D., Schier, A.F., and Megason, S.G., Specified neural progenitors sort to form sharp domains after noisy shh signaling, 550-561, Copyright (2013) with permission from Elsevier. Full text @ Cell