Fig. 1
- ID
- ZDB-FIG-130404-13
- Publication
- Yoo et al., 2012 - The role of microtubules in neutrophil polarity and migration in live zebrafish
- Other Figures
- All Figure Page
- Back to All Figure Page
|
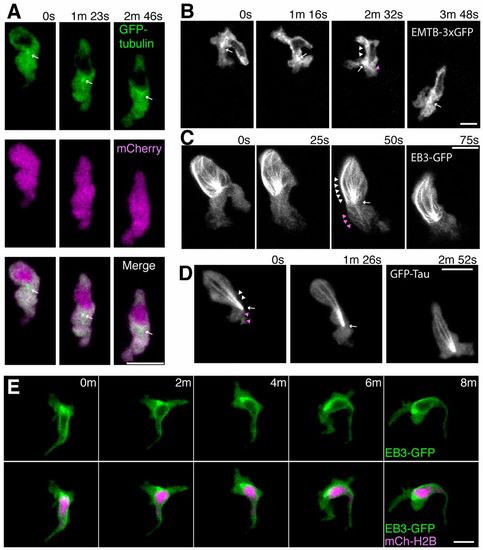
Localization of microtubules during neutrophil motility in live zebrafish. (A) Time-lapse imaging of a neutrophil expressing GFP-tubulin and mCherry. Arrows indicate a punctate dot in front of the nucleus. Note that fluorescent signals of GFP-tubulin are excluded from the nucleus. (B) Time-lapse imaging of a neutrophil expressing EMTB-3xGFP. A punctate dot, presumably the MTOC, is indicated by arrows. Arrowheads indicate linear structures (presumably microtubules) extending to the leading edge (magenta) and to the uropod (white). (C) Time-lapse imaging of a neutrophil expressing EB3-GFP. An arrow indicates the MTOC and arrowheads indicate microtubules extending to the leading edge (magenta) and to the uropod (white). (D) Time-lapse imaging of a neutrophil expressing GFP-Tau. An arrow indicates the MTOC and arrowheads indicate microtubules extending to the leading edge (magenta) and to the uropod (white). (E) Time-lapse imaging of a neutrophil expressing EB3-GFP and a nucleus probe mCherry-histone H2B. Data are representative of more than three separate time-lapse movies. Scale bars: 10 μm. |

