Fig. 2
- ID
- ZDB-FIG-130306-2
- Publication
- So et al., 2013 - Wnt/beta-catenin signaling cell-autonomously converts non-hepatic endodermal cells to a liver fate
- Other Figures
- All Figure Page
- Back to All Figure Page
|
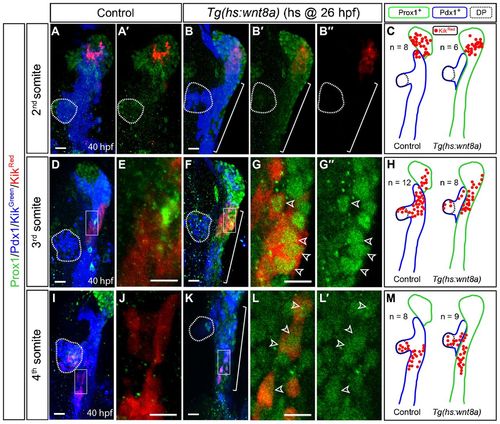
Wnt8a overexpression does not induce the posterior migration of hepatoblasts. The lineage of endodermal cells at the 2nd, 3rd, or 4th somite level was traced. (A?C) Lineage tracing of endodermal cells at the 2nd somite level. The distribution of KikRed+ cells in control is similar to that in Wnt8a-overexpressing embryos. Cartoons incorporating all lineage-tracing data (C). (D?H) Lineage tracing of endodermal cells at the 3rd somite level. Most KikRed+ cells expressed Prox1 (green) in Wnt8a-overexpressing embryos (G, open arrowheads), whereas a small number of KikRed+ cells did in controls (E). Higher magnification images of the square regions in D and F are shown in E and G, respectively, without Pdx1 and Kikgreen expression. (I?M) Lineage tracing of endodermal cells at the 4th somite. Many KikRed+ cells expressed Prox1 (green) in Wnt8a-overexpressing embryos (L, open arrowheads), whereas none of the cells did in controls (J). Higher magnification images of the square regions in I and K are shown in J and L, respectively, without Pdx1 and Kikgreen expression. Green and blue lines outline Prox1+ and Pdx1+ domains, respectively, and n indicates the number of embryos (C,H,M). Brackets delineate the endodermal region in which ectopic hepatoblasts are present (B?B3,F,K). Dotted lines outline the dorsal pancreas (DP). Ventral views, anterior up. Scale bars, 20Ám. |

