Fig. 1
- ID
- ZDB-FIG-130206-6
- Publication
- Li et al., 2012 - Reciprocal Regulation between Resting Microglial Dynamics and Neuronal Activity In Vivo
- Other Figures
- All Figure Page
- Back to All Figure Page
|
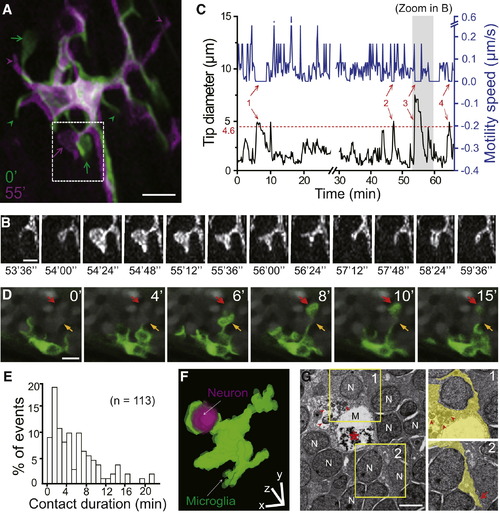
Resting Microglia Contact Neuronal Soma via Bulbous Endings(A) Overlay of two projected images of a resting microglia acquired at 0 (green) and 55 min (magenta) during in vivo time-lapse confocal imaging of optic tectum in a 6-dpf Tg(Apo-E:eGFP) zebrafish larva. Arrows and arrowheads indicate bulbous endings and stick-like endings, respectively.(B) Dynamics of the process originated from a primary branch in the dashed square in (A). It is analyzed in (C).(C) Changes over time in tip diameter (black) and extension/retraction (motility) speed (blue) of microglial process shown in (B). Dashed line indicates mean diameter of tectal neuronal soma (4.6 ± 0.2 μm), and numbered arrows mark bulbous ending occurrence. Shadowed area indicates the period during which images shown in (B) were obtained. Break in the time axis represents a 1.4 min scanning pause at time point of 28.6 min.(D) Time-lapse series showing that bulbous endings contact neuronal somata (gray) in a 6-dpf Tg(Apo-E:eGFP) larva with tectal neurons visualized by OGB-AM. Yellow and red arrows indicate two tectal neurons sequentially contacted by bulbous endings originating from the same microglial process.(E) Distribution of the duration of microglial contact with neurons. Data obtained from all 113 contact events observed from seven microglial cells in five larvae.(F) Three-dimensional reconstruction of a contact between a microglial bulbous ending (green) and a tectal neuronal soma (magenta). Original image obtained from a 5-dpf Tg(Apo-E:eGFP,Mü 4380) larva.(G) Electron microscopic images of zebrafish optic tectum longitudinal section at 6 dpf. Inset 1: microglial processes (yellow) wrapping around a neuronal soma (?N?); Inset 2: a stick-like process (arrow) passing by surrounding neuronal somata. Nucleus, asterisk; inclusion body/vesicle in microglia (?M?), arrowhead.Scale bars: 10 μm in (A), 4 μm in (B), (D), and (F), and 2 μm in (G).See also Figure S1 and Movie S1. |
| Gene: | |
|---|---|
| Fish: | |
| Anatomical Terms: | |
| Stage: | Day 6 |
Reprinted from Developmental Cell, 23(6), Li, Y., Du, X.F., Liu, C.S., Wen, Z.L., and Du, J.L., Reciprocal Regulation between Resting Microglial Dynamics and Neuronal Activity In Vivo, 1189-1202, Copyright (2012) with permission from Elsevier. Full text @ Dev. Cell

