Fig. 1
- ID
- ZDB-FIG-130117-33
- Publication
- Sousa et al., 2012 - A new zebrafish bone crush injury model
- Other Figures
- All Figure Page
- Back to All Figure Page
|
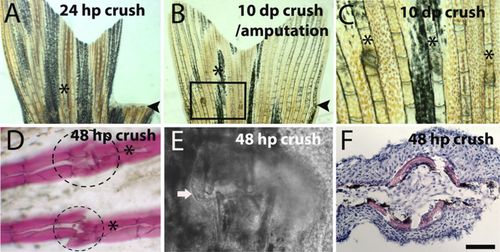
Differences in tissue architecture after crush and amputation induced regeneration in the same caudal fin. (A?C) Bright filed image of a caudal fin after crush and cut at (A) 24hpc/a and (B) 10dpc/a. (C) Magnification of the inset in picture B. (D) Alizarin Red staining for bone matrix at 48hpc; dashed lines indicates the region of callus formation that is not stained with Alizarin Red. (E) Bright field confocal image of 48hpc injury site, the arrow highlights the callus structure. (F) Hematoxilin/Eosin staining in a transversal section of a 48hpc ray. Arrowheads indicate the amputation plane and asterisks indicate crush injury area in A and B, and crush injury sites in C and D. Scale bar corresponds to 500μm in A and B, 200μm in C, 100μm in D and 50µμm in E and F. (hpa ? hours post-amputation; hpc ? hours post-crush injury). |

