
Fig. 3
- ID
- ZDB-FIG-121206-4
- Publication
- Giurumescu et al., 2012 - Quantitative semi-automated analysis of morphogenesis with single-cell resolution in complex embryos
- Other Figures
- All Figure Page
- Back to All Figure Page
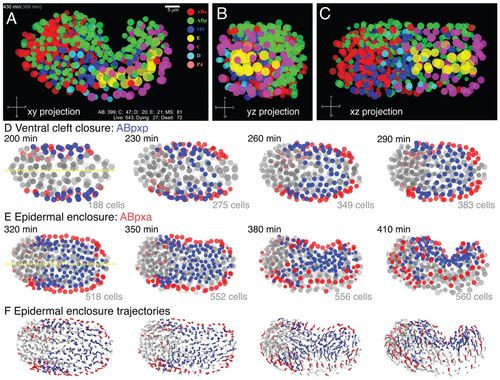
Visualization of late stage C. elegans embryonic morphogenesis with single cell resolution. Visualization of morphogenetic movements from digital 4D movies, focusing on epidermal enclosure. Nuclei are depicted as semitransparent circles (A-E) or as trajectory flow fields (F). (A-C) Orthogonal views of 430-minute embryo; see also supplementary materialMovies 1, 2. Time stamps at upper left denote actual movie time (gray, in parentheses) and estimated time since first cleavage (movie time + 91 minutes). The counters on lower right side show numbers of surviving descendants of each sublineage, total number of live nuclei, dying nuclei (cells undergoing apoptosis but still visible) and dead nuclei (no longer visible). All views are of the same data set from the ventral surface (xy view, A), posterior side (yz, B) and left lateral side (xz, C). Cells are color coded according to lineage origin. (D,E) ABp descendants undergo successive epiboly-like collective movements towards the ventral midline (yellow) during gastrulation cleft closure (200-290 minutes, D) and epidermal enclosure (320-410 minutes, E). ABpxp descendants (blue) are predominantly involved in ventral cleft closure; ABpxa descendants (red) are predominantly involved in epidermal enclosure. Images are every 30 minutes; cell counts include live and dying cells. (F) Flow field of nuclear trajectories during epidermal enclosure; ABpxx lineage coding as in D,E; 15-minute trajectories. |