
Fig. 2
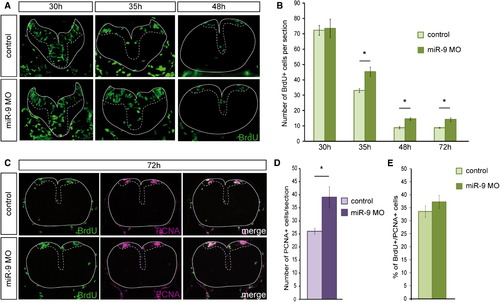
miR-9 Depletion Increases Proliferation along the Hindbrain VZ at Late Stages (A) Transverse sections showing short pulse BrdU labeling of control and miR-9 MO-injected embryos at 30 hpf, 35 hpf, and 48 hpf. (B) Number of BrdU-positive cells per 5-μm section at 30 (n = 4 embryos per condition), 35 (n = 6), 48 (n = 9), 72 hpf (n = 9) in control or injected embryos. (C) Transverse sections showing BrdU (green) and PCNA (purple) immunostaining after short pulse labeling at 72 hpf (n = 9). (D) Number of PCNA-positive cells per 5-μm section. (E) Proportion of BrdU-positive cells among PCNA-positive cells. The VZ is highlighted with a dotted line. p < 0.01. Values are presented as mean � SEM. See also Figure S2. |
| Gene: | |
|---|---|
| Fish: | |
| Knockdown Reagent: | |
| Anatomical Term: | |
| Stage: | Protruding-mouth |
| Fish: | |
|---|---|
| Knockdown Reagent: | |
| Observed In: | |
| Stage Range: | Long-pec to Protruding-mouth |
Reprinted from Developmental Cell, 22(5), Coolen, M., Thieffry, D., Drivenes, O., Becker, T.S., and Bally-Cuif, L., miR-9 Controls the Timing of Neurogenesis through the Direct Inhibition of Antagonistic Factors, 1052-1064, Copyright (2012) with permission from Elsevier. Full text @ Dev. Cell