
Fig. 7
- ID
- ZDB-FIG-120216-96
- Publication
- Goonesinghe et al., 2012 - Desmosomal cadherins in zebrafish epiboly and gastrulation
- Other Figures
- All Figure Page
- Back to All Figure Page
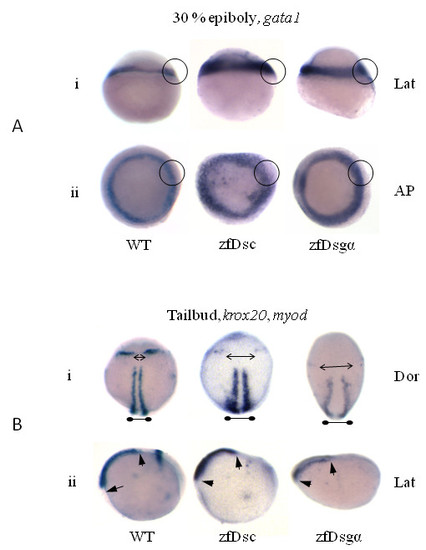
Knockdown of desmosomal cadherins affects gastrulation movements. In situ hybridisation images for gata1 at 30% epiboly (A) and myod, krox20 (B) at tailbud stage for both zfDsc1 and zfDsg2a morphant embryos. WT embryos are shown for comparison. A.i. and A.ii. show the lateral (Lat) and animal pole (AP) views, respectively. Circles indicate the expanded expression of gata1 in the germ ring margin of the morphants. B.i. and B.ii. show the dorsal (Dor) and lateral (Lat) views, respectively. Double headed arrows in B.i. indicate medio-lateral expansion of the distance between krox20 markers (pointed arrows) and myod marker (blunted arrows). Short arrows in B.ii show reduced rostro-caudal extension as indicated by the myod marker. |
| Genes: | |
|---|---|
| Fish: | |
| Knockdown Reagents: | |
| Anatomical Terms: | |
| Stage Range: | 30%-epiboly to Bud |