Fig. 1
|
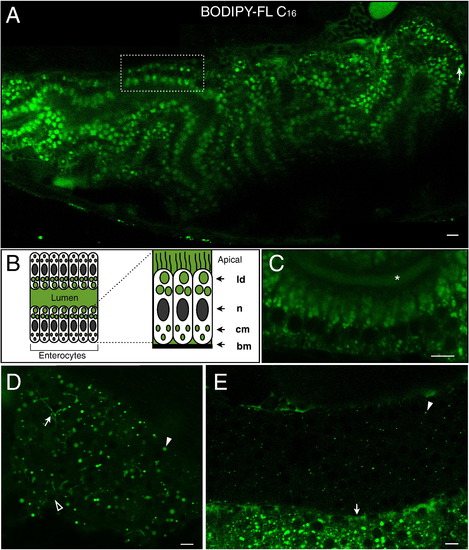
BODIPY-FL C16 accumulates in lipid droplets in the digestive organs of live larval zebrafish. In all images, anterior is to the right to allow liver viewing. A. Enterocytes of the anterior intestinal bulb readily absorb BODIPY-FL C16 following an egg yolk and analog feed. The dotted box indicates a row of intestinal enterocytes exhibiting apical and basolateral accumulation of BODIPY-FL C16. Larger gaps in intestinal fluorescence (arrow) are likely non-absorbing enteroendocrine cells (Wallace et al., 2005). B. A schematic of lipid metabolism in polarized intestinal enterocytes. Enterocytes take up lipids from the intestinal lumen, form lipid droplets (ld) and secrete basolateral chylomicrons (cm). The basement membrane (bm) and cell nucleus (n) are also indicated. C. Intestinal enterocytes (dotted box indicates a single enterocyte) of larvae fed BODIPY-FL C16 display apical lipid droplets and smaller basolateral fluorescent foci reminiscent of chylomicrons. The intestinal lumen is indicated (asterisk). D. BODIPY-FL C16 accumulates within large hepatic lipid droplets (filled arrowhead) and faintly in hepatic ducts (arrow). Hepatocyte nuclei (empty arrowhead) are also visible. E. BODIPY-FL C16 accumulates throughout the exocrine pancreas, forming small fluorescent foci (arrowhead). Beneath the exocrine pancreas, an intestinal blood vessel (arrow) running the length of the intestine fluoresces, indicating analog entry into the vascular system. A is a composite of 3 separate confocal images. Scale bars = 10μm. (n = 3; 6 larvae per feed.) |
Reprinted from Developmental Biology, 360(2), Carten, J.D., Bradford, M.K., and Farber, S., Visualizing digestive organ morphology and function using differential fatty acid metabolism in live zebrafish, 276-85, Copyright (2011) with permission from Elsevier. Full text @ Dev. Biol.

