Fig. S1
|
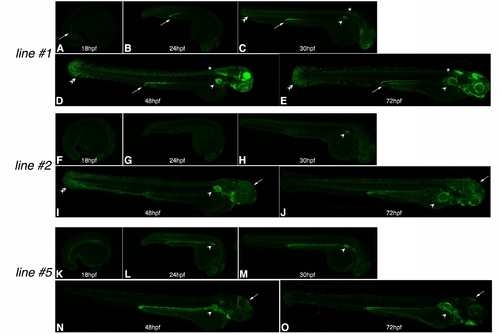
Analysis of reporter gene expression in other tissues than the pectoral fins: the mPrx1(cFos):EGFP lines. A–E: mPrx1(cFos):EGFP line#1. Apart from the expression in the developing pectoral fins from 27 hours postfertilization (hpf)onwards (marked here by arrowheads in C–E), enhanced green fluorescent protein (EGFP) signal is observed in the following territories: (i) In the pronephric duct from 18 hpf (arrows in A–E). (ii) From 30 hpf, EGFP labels some mesenchymal cells in the median fin fold (double arrowheads in C–E). (iii) Some cells of the spinal cord at the level of the pectoral fin from 27 hpf onward (asterisks in C–E and Fig. 2 A, B). (iv) From 48 hpf, expression of EGFP is observed in anterior brain and retina. F–J: mPrx1(cFos):EGFP line#2. Apart from the expression in the developing pectoral fins from 27 hpf onward (marked here by arrowheads in H–J), EGFP signal is observed in the following areas: (i) At 48 hpf, EGFP labels some mesenchymal cells in the median fin fold (double arrowheads in I) and (ii) in mesenchymal cells in the dorsal aspect of the head at 48 and 72 hpf (arrows in I, J). K–O: mPrx1(cFos):EGFP line#5. Apart from the expression in the developing pectoral fins from 24 hpf onward (marked by arrowheads in L–O), EGFP signal is also observed in a dorsal cranial bone of the 48 and 72 hpf embryos marked by arrows in N and O. Specific sites of reporter gene expression (other than the limb) in each of the transgenic lines generated may represent positional effects due to different integration sites of the transgene. Reporter gene expression is also detected in areas of the ventral head mesenchyme in all the transgenic lines created which is a characteristic of the mPrx1 limb element (Logan et al., 2002). Nonspecific expression in the dorsal-most aspect of the yolk extension is observed in all three transgenic lines (A–O). |

