
Fig. 2
- ID
- ZDB-FIG-101223-8
- Publication
- Diz-Munoz et al., 2010 - Control of Directed Cell Migration In Vivo by Membrane-to-Cortex Attachment
- Other Figures
- All Figure Page
- Back to All Figure Page
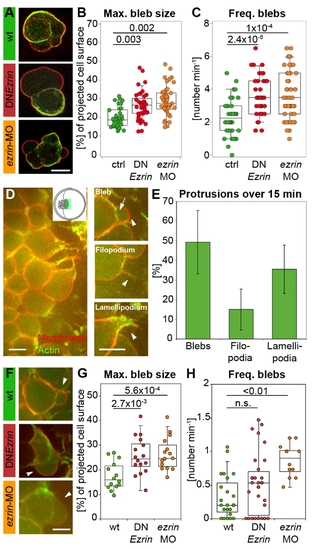
ERM proteins modulate prechordal plate progenitor cell protrusion formation. (A) Examples of isolated control and ERM-deficient prechordal plate progenitor cells. (B) Maximum bleb size in isolated control and ERM-deficient prechordal plate progenitor cells. (C) Frequency of bleb formation in isolated control and ERM-deficient prechordal plate progenitor cells. (D) Animal view of the leading edge of a wt prechordal plate. Inset shows a schematic animal view of an embryo at 80% epiboly, with the green rectangle marking the imaged area in (D). Examples of a bleb, filopodium, and lamellipodium in prechordal plate leading edge cells. Arrowheads point to the protrusions. Arrow indicates the separation between actin cortex and membrane in the bleb. (E) Percentage of blebs, filopodia, and lamellipodia in wt prechordal plate leading edge cells (mean ± half standard deviation). (F) Example blebs (arrowheads) in wt and ERM-deficient prechordal plate leading edge cells. (G) Maximum bleb size in wt and ERM-deficient prechordal plate leading edge cells. (H) Frequency of bleb formation in wt and ERM-deficient prechordal plate leading edge cells. Plasma membrane (GPI-RFP) is red; actin cortex (Lifeact-GFP) is green. Scale bars = 10 μm. The projected bleb size in (B) and (G) was normalized to the projected cell size. Number of analyzed blebs in (B) and (C) = 39 (control), 42 (DNEzrin), and 51 (ezrin-MO) and in (G) = 14 (wt), 16 (DNEzrin), and 15 (ezrin-MO). Number of analyzed cells in (E) and (H) = 23 (wt), 30 (DNEzrin), and 12 (ezrin-MO). Statistical significance was determined using t test (G) or Mann?Whitney U test (B, C, and H). |
| Fish: | |
|---|---|
| Knockdown Reagent: | |
| Observed In: | |
| Stage: | 75%-epiboly |