
Fig. 4
- ID
- ZDB-FIG-101122-60
- Publication
- Ozbudak et al., 2010 - Spatiotemporal compartmentalization of key physiological processes during muscle precursor differentiation
- Other Figures
- All Figure Page
- Back to All Figure Page
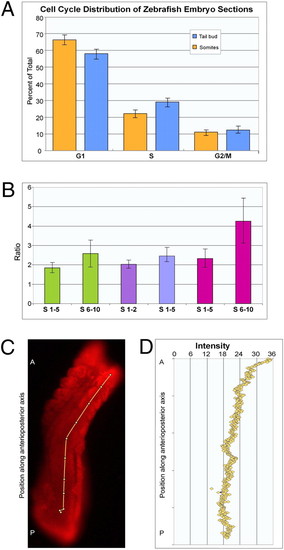
Biological validation of the compartmentalization of cell cycle/DNA metabolism and translation/oxidative metabolism along the PSM. (A) The DNA content of tail bud cells (orange) is compared against the last six-to-eight formed somites (blue) from both the Left and Right sides. P values from the one-tail t test are 0.00019, 0.00043, and 0.0589 for the three phases, respectively. Standard deviations are plotted in the panel. (B) The ratio of different measurements (values are obtained from cells in the anterior locations and divided by those in the posterior locations) are shown in histograms. The total protein level (green) is increased in the anterior sections of the embryo 1.8-fold and 2.5-fold, at the spatial position: somites 1 to 5 (S 1?5) or somites 6 to 10 (S 6?10), respectively, compared with that of the posterior PSM. The ATP level (purple) is increased 2-fold in somites 1 and 2 (S 1?2) compared with the tail bud. The cytochrome-C oxidase activity level (blue) is also increased in the last five formed somites (S 1?5) by 2.5-fold compared with the posterior PSM. H2O2 level (pink) also progressively increases in the anterior sections of the embryo from 2.3-fold and 4.3-fold, at spatial position: somites 1 to 5 (S 1?5) or somites 6 to 10 (S 6?10), respectively, compared with that of in the posterior PSM. All ratios were obtained by normalizing by DNA content in the respective samples. Error bars represent SEM. (C) A representative zebrafish embryo stained with MitoTracker Orange CM-H2TMROS. (D) y axis shows the intensity of fluorescence measured along the anterioposterior axis through the yellow line in C from somites (A, anterior) to the tail bud (P, posterior). |