
Fig. S2
- ID
- ZDB-FIG-101116-1
- Publication
- Padmanabhan et al., 2009 - Cardiac and vascular functions of the zebrafish orthologues of the type I neurofibromatosis gene NFI
- Other Figures
- All Figure Page
- Back to All Figure Page
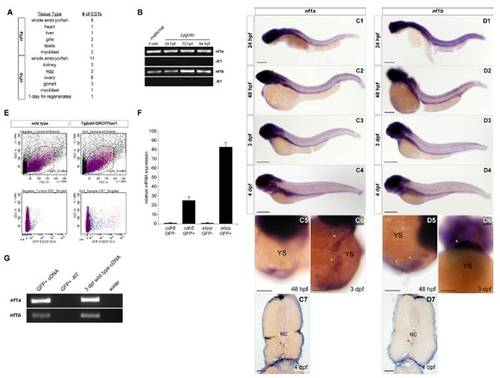
Zebrafish nf1a and nf1b are expressed during embryonic development. (A) Distribution of ESTs mapping to nf1a or nf1b in dbEST including tissue of origin. (B) RT-PCR analysis verifying maternal (one-cell) and zygotic (24, 72, and 84 hpf) expression of nf1a and nf1b. (C1?C6 and D1?D6) Whole-mount in situ hybridization of 24-hpf, 48-hpf, 3-dpf (all magnifications of insets in Fig. 2), and 4-dpf zebrafish embryos shows temporal and spatial expression patterns of nf1a and nf1b. (C5?C6 and D5?D6) Both nf1a and nf1b are expressed in cardiac tissue at 48 hpf and 3 dpf as seen in these anteroventral images. Notably, analysis of 14 μm (C7 and D7) cross-sections of whole-mount stained 4-dpf zebrafish embryos reveals strong nf1a and nf1b expression in the region of the dorsal vessel (arrows) directly below the notochord (NC). (E) Parameters used for sorting GFP-positive and GFP-negative cells from 3.5-dpf Tg(kdrl:GRCFP)zn1 zebrafish embryos. (F) Quantitative PCR analysis of the GFP-positive cell fraction reveals marked enrichment for endothelial-specific genes, including cdh5 and etsrp, relative to the GFP-negative fraction. (G) Reverse-transcription and PCR (RT-PCR) for nf1a and nf1b was performed using first-strand cDNA synthesized from endothelial cell RNA (GFP-positive cell fraction), confirming expression of both genes in vascular endothelium. (Scale bars: 25 μm.) |