
Fig. 6
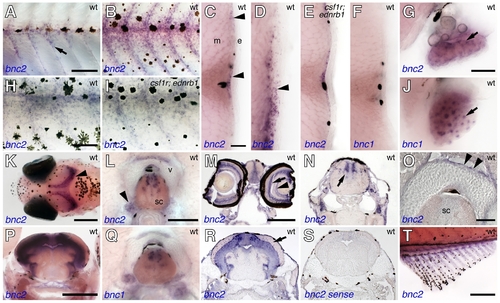
bnc2 and bnc1 expression in diverse tissues during the larval-to-adult transformation. (A) bnc2 transcript was seen in hypodermal cells during early stages of pigment pattern metamorphosis (7.0 mm standardized standard length; 7 SSL [79]). (B) bnc2+ cells were more widely scattered over the flank during middle stages of pigment pattern metamorphosis (∼10 mm SL). (C) In cross sections, bnc2+ cells (purple stained, arrowheads) occurred at the level of the hypodermis, near the horizontal myoseptum as well as further dorsally and ventrally (∼9 mm SL). Black melanophores also were present in the epidermis (e) and myotome (m). (D) In further ventral regions at the same stage, bnc2+ cells were present both within the hypodermis and in the epidermis (arrowhead). (E) The distribution of bnc2+ cells in csf1r; ednrb1 double mutants was similar to that of wild-type, suggesting bnc2+ cells are not xanthophores or iridophores. (F) In contrast, bnc1 was not expressed in the skin or hypodermal region at comparable stages as detectable by in situ hybridization. (G) In the ovary, bnc2 was expressed by somatic cells (arrow). (H,I) Higher magnification views of bnc2 expression at 10 SSL in wild-type (H) and csf1r; ednrb1 double mutants (I), with similar staining patterns. (J) In contrast to bnc2, bnc1 transcript was seen in ovarian oocytes. (K) Dorsal head of 9 SSL larva showing bnc2 expression in the brain (arrowhead). (L) bnc2+ cells in dorsal spinal cord (sc), ganglia (arrowhead), and dorsal superficial cells of vertebral centrum (v). (M) Transverse cryosection through the head revealed expression in the eye, including the inner nuclear layer and ganglion cell layer (arrow and arrowhead, respectively) and in the diencephalon. (N) Cryosection showing bnc2 staining in the hindbrain (arrow). (O) Detail showing staining of superficial cells of centrum (arrowheads). (P) Transverse vibratome section through midbrain showing bnc2+ cells in periventricular grey zone (PGZ) of the tectum. (Q) Staining for bnc1 in dorsal spinal cord. (R). Cryosection through midbrain showing broad staining within the PGZ as well as individual scattered bnc2+ cells within the tectum (arrow). (S) bnc2 sense control probe. (T) bnc2 was also expressed in the fins, including the anal fin shown here (∼12 SSL). Scale bars: in (A), 100 μm for (A,B); in (H), 50 μm for (H,I); in (C), 20 μm for (C?F); in (G), 40 μm for (G,J); in (K), 200 μm; in (L), 50 μm, for (L,Q); in (M), 200 μm for (M,N,R,S); in (O), 20 μm; in (P), 200 μm; in (T), 200 μm. |
| Genes: | |
|---|---|
| Fish: | |
| Anatomical Terms: | |
| Stage Range: | Days 14-20 to Days 30-44 |