
Fig. 3
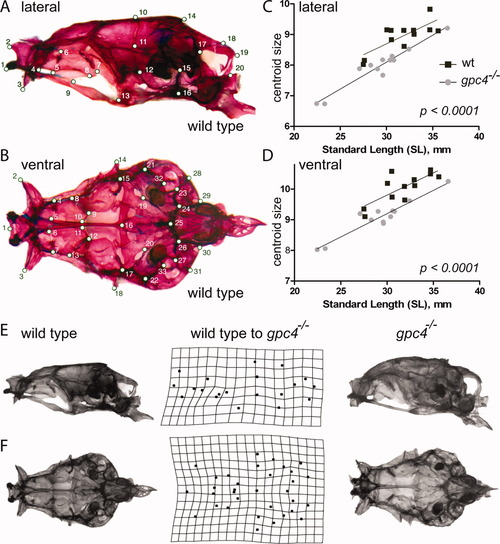
Size and shape comparison of wild type and gpc4-/- neurocraniaLocations of 20 lateral (A) and 33 ventral (B) skull landmarks used in the study. A complete description of each landmark is given in Supp. Table S1. In both views, a wild type skull is shown. C, D: Linear regression of lateral (C) and ventral (D) skull centroid size versus standard length for wild type (wt) and gpc4-/- mutant zebrafish. gpc4-/- neurocrania are significantly smaller than wild type neurocrania across a wide range of body sizes, as indicated by the significant downward shift in the gpc4-/- regression line (P < 0.0001 for differences in intercept). Lateral (E) and ventral (F) views of a wild type (left column) and gpc4-/- (right column) zebrafish skull. Center column: Deformation grid of neurocranial landmarks used in the study, derived from Procrustes superimposition of all wild type (n = 12) and gpc4-/- (n = 12) specimens. The grid indicates how the configuration of landmarks (A, B) must be altered to “convert” a wild type skull (left) into a mutant skull (right). Perfectly square cells indicate no difference in mean shape between mutants and wild types; deviations from squares indicate the regions of local shape difference between the two groups. |