|
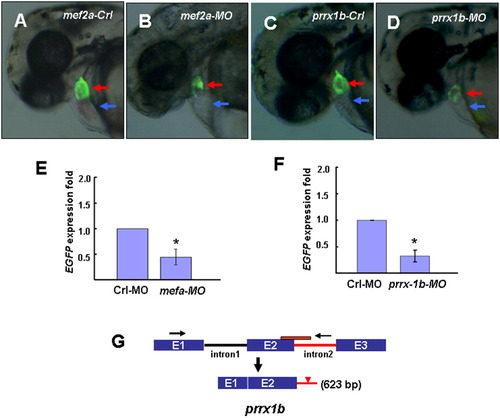
mef2a and prrx1b knockdown reduced transgene EGFP expression. A-D: Lateral view showing reduced EGFP expression in embryos injected with mef2a-MO and prrx1b-MO (B,D), when compared to embryos injected with control morpholinos (A,C). Red arrows, ventricle; blue arrows, atrium. E,F: Bar chart depicting relative EGFP expression folds in mef2a and prrx1b morphants versus control embryos injected with mismatched morpholinos. Three independent experiments were conducted. Error bars indicate standard deviation, and asterisks indicate statistical significance between morphant and control embryos (P < 0.01). G: Schematic graph depicting the prrx1b gene structure and the inhibitory splicing donor site targeted by prrx1b-MO. Red bar, prrx1b morpholinos; red arrowhead, stop codon; black arrow, sequence primers.
|