
FIGURE
Fig. S1
- ID
- ZDB-FIG-090408-56
- Publication
- Schebesta et al., 2009 - olig1 expression identifies developing oligodendrocytes in zebrafish and requires hedgehog and notch signaling
- Other Figures
- All Figure Page
- Back to All Figure Page
Fig. S1
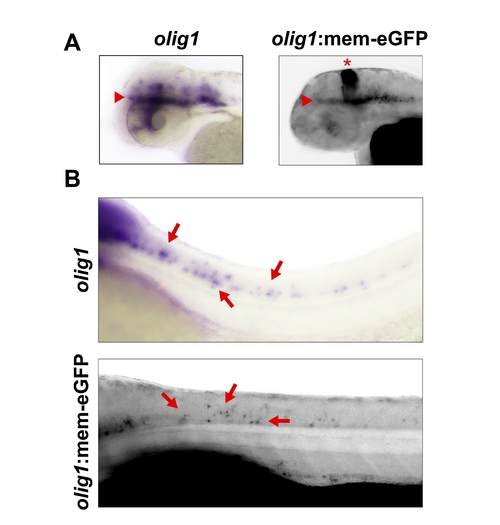
eGFP expression in olig1:mem-eGFP recapitulates endogenous olig1 expression determined by in situ hybridization. A: Side view comparison of brain expression at 48 hpf. Red arrowheads indicate midbrain oligodendrocytes and red asterisk marks ectopic expression of eGFP in the region of the cerebellum. B: Side view comparison of anterior spinal cord expression at 48 hpf. |
Expression Data
Expression Detail
Antibody Labeling
Phenotype Data
Phenotype Detail
Acknowledgments
This image is the copyrighted work of the attributed author or publisher, and
ZFIN has permission only to display this image to its users.
Additional permissions should be obtained from the applicable author or publisher of the image.
Full text @ Dev. Dyn.