
Fig. 2
- ID
- ZDB-FIG-090304-6
- Publication
- Ellett et al., 2009 - The role of the ETS factor erg in zebrafish vasculogenesis
- Other Figures
- All Figure Page
- Back to All Figure Page
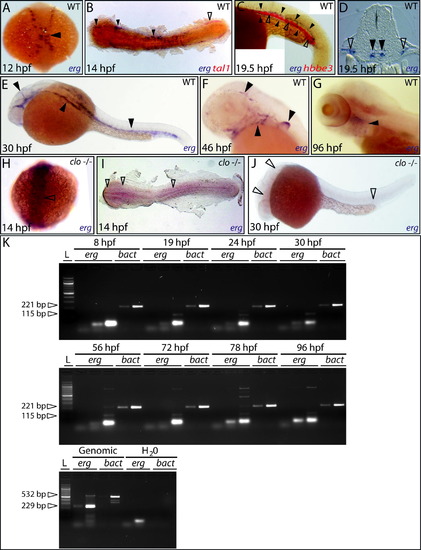
erg expression during early zebrafish development. (A) Earliest expression of erg in lateral plate mesoderm at approximately 12 hpf (dorsal view, full arrowhead). (B) Flat-mount preparation shows overlap of early erg expression (blue) with tal1 expression (red) in vascular (filled arrowheads) but not haematopoietic progenitors (empty arrowhead). (C) Lateral view of tail displaying ICM expression of erg in developing vascular structures (blue, full arrowheads) partially overlapping that of the embryonic globin hbbe3 (red, empty arrowheads) as the developing caudal vein coalesces around erythroid cells prior to circulation. (D) Transverse section showing erg expression in bifurcated cental arterial (filled arrowheads) and lateral venous structures (empty arrowheads). (E) erg expression at 30 hpf in all developing vascular structures in the brain, trunk and tail of the embryos (full arrowheads). (F) Later erg expression restricted to vasculogenesis in the brain, aortic arches and developing fin bud (full arrowheads). (G) erg expression remains detectable in the aortic arches at 96 hpf (full arrowhead). (H–J) erg expression is absent in the cloche (clo) mutant during angioblast specification and during vasculogenesis (empty arrowheads indicate sites of loss of erg expression). (clo genotype recognised from the expected Mendelian ratio). All panels containing whole-mount in situ hybridisation analyses; unless otherwise stated, anterior is to the left, and, except in flat-mounts, dorsal is to the top. (K) Semi-quantitative RT-PCR showing erg expression over the time period described (25, 30 and 35 cycles shown). β-actin (bact) expression was used as a positive control for each timepoint and to show linear amplification (20 and 25 cycles shown). Each primer pair was designed to span an intron, providing a genomic DNA-contamination internal negative-control. For more details, see Section 4. |
| Genes: | |
|---|---|
| Fish: | |
| Anatomical Terms: | |
| Stage Range: | 75%-epiboly to Day 4 |
Reprinted from Mechanisms of Development, 126(3-4), Ellett, F., Kile, B.T., and Lieschke, G.J., The role of the ETS factor erg in zebrafish vasculogenesis, 220-229, Copyright (2009) with permission from Elsevier. Full text @ Mech. Dev.