
FIGURE
Fig. 2
- ID
- ZDB-FIG-090224-17
- Publication
- Li et al., 2009 - Tracking gene expression during zebrafish osteoblast differentiation
- Other Figures
- All Figure Page
- Back to All Figure Page
Fig. 2
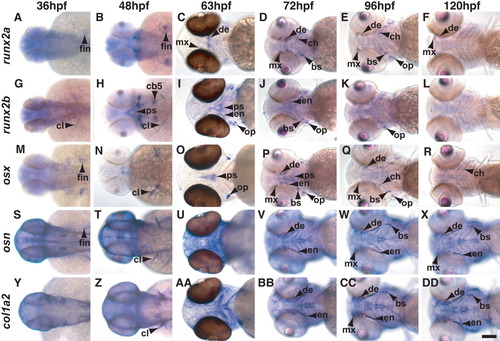
A-Z: Osteoblast gene expression: dorsal and ventral views. Six stages of development are shown in dorsal views at 36 and 48 hours postfertilization (hpf; A,B,G,H,M,N,S,T,Y,Z), and in ventral views at 63, 72, 96, and 120 hpf (C-F,I-L,O-R,U-X,AA-DD). A high resolution image of this figure is available online. See Figure 1 for abbreviations. Scale bar = 200 μM in DD. |
Expression Data
| Genes: | |
|---|---|
| Fish: | |
| Anatomical Terms: | |
| Stage Range: | Prim-25 to Day 5 |
Expression Detail
Antibody Labeling
Phenotype Data
Phenotype Detail
Acknowledgments
This image is the copyrighted work of the attributed author or publisher, and
ZFIN has permission only to display this image to its users.
Additional permissions should be obtained from the applicable author or publisher of the image.
Full text @ Dev. Dyn.