
Fig. 4
- ID
- ZDB-FIG-081013-30
- Publication
- Snow et al., 2008 - Time-lapse analysis and mathematical characterization elucidate novel mechanisms underlying muscle morphogenesis
- Other Figures
- All Figure Page
- Back to All Figure Page
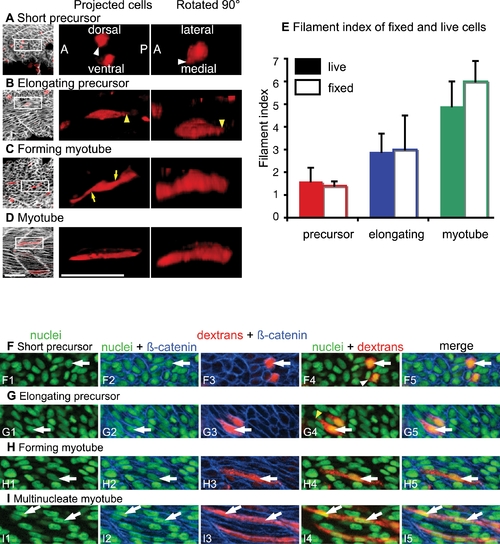
Mathematical Characterization of Fixed Cells Supports Time-Lapse Analysis of Live Cells. (See also Movie S4.) ApoTome images, side views, anterior left, dorsal top, 22 somite-stage fixed embryos. A?D) Dextran-labeled cells (red), β-catenin staining outlines cells (white). Rotated 90° projections were stretched≈3 fold in the Z dimension due to the relative thinness of the tissue. Scale bars: 50 μm. A) Short muscle precursor cells are short and extend small protrusions (white arrowheads). B) Long protrusions extended along the major axis of the cell are observed (yellow arrowheads). C) Irregularly shaped cells that span the entire width of the myotome are observed (yellow arrows). D) Long regularly shaped myotube. E) Graph showing that the filament indexes for live and fixed cells are similar. F?H) 22 somite-stage fixed embryo, nuclei are stained with Sytox green, dextran-labeled cells are red, β-catenin in blue outlines cells. Although the nuclear content of cells was analyzed in all focal planes, only one focal plane is shown for clarity. White arrows point to nuclei. F) Precursor cells are short and have one nucleus (white arrowhead in F4 shows short protrusion). G) Cells that were elongating when fixed were never observed to contain more than 1 nucleus (yellow arrowhead shows a long protrusion). H) An elongated cell with 1 nucleus. I) Multinucleate myotube. |