
FIGURE
Fig. 2
Fig. 2
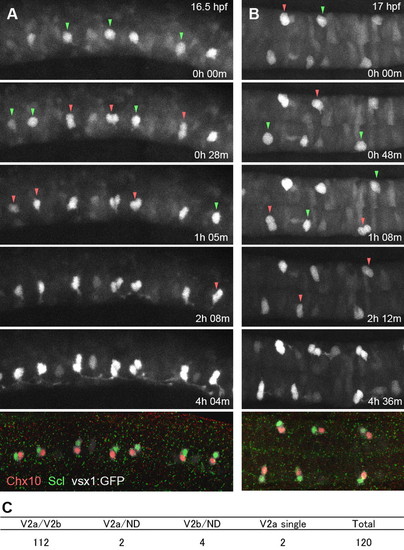
Time-lapse imaging of vsx1-GFP cells showing that V2a and V2b neurons are produced as siblings. (A,B) Time-lapse imaging of vsx1-GFP cells, followed by immunohistochemical localization of Chx10 (red, V2a) and Scl (green, V2b). (A) Lateral view. (B) Dorsal view. Images are montages of stacked optical sections. Green arrowheads indicate cells prior to division. Red arrowheads indicate paired cells after division. Movies for these analyses are available in the supplementary material. (C) Summary of time-lapse imaging. |
Expression Data
| Genes: | |
|---|---|
| Fish: | |
| Anatomical Term: | |
| Stage Range: | 14-19 somites to 20-25 somites |
Expression Detail
Antibody Labeling
Phenotype Data
Phenotype Detail
Acknowledgments
This image is the copyrighted work of the attributed author or publisher, and
ZFIN has permission only to display this image to its users.
Additional permissions should be obtained from the applicable author or publisher of the image.
Full text @ Development