
FIGURE
Fig. S2
Fig. S2
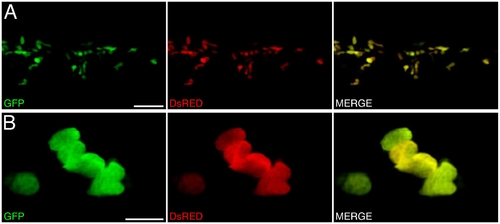
Co-localized expression of EGFP and DsRED2 within lysC::EGFP/lysC::DsRED2 compound transgenic larvae. (A) Summed Z-stacks through ICM compartment of EGFP and DsRED2 expression (and merged images) within 48 hpf lysC::EGFP/lysC::DsRED2 larva. (B) Higher magnification within same region. Scale bars: 50 μm in A; 10 μm in B. |
Expression Data
Expression Detail
Antibody Labeling
Phenotype Data
Phenotype Detail
Acknowledgments
This image is the copyrighted work of the attributed author or publisher, and
ZFIN has permission only to display this image to its users.
Additional permissions should be obtained from the applicable author or publisher of the image.
Full text @ BMC Dev. Biol.