
FIGURE
Fig. 1
- ID
- ZDB-FIG-070920-35
- Publication
- Krens et al., 2006 - Characterization and expression patterns of the MAPK family in zebrafish
- Other Figures
- All Figure Page
- Back to All Figure Page
Fig. 1
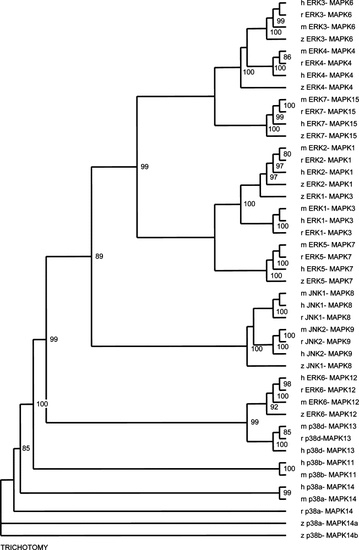
Unrooted phylogenetic tree of the zebrafish MAPK family to other vertebrates. The tree was constructed by neighbor-joining analysis based on an alignment of the amino acid sequences of the complete predicted and sequencing verified coding sequences. The numbers indicate the occurrence of nodes during bootstrap analysis. The bootstrap values are given as percentages of 10,000 reiterations and only values above 80 are shown. h, human; m, mouse; r, rat; z, zebrafish. |
Expression Data
Expression Detail
Antibody Labeling
Phenotype Data
Phenotype Detail
Acknowledgments
This image is the copyrighted work of the attributed author or publisher, and
ZFIN has permission only to display this image to its users.
Additional permissions should be obtained from the applicable author or publisher of the image.
Reprinted from Gene expression patterns : GEP, 6(8), Krens, S.F., He, S., Spaink, H.P., and Snaar-Jagalska, B.E., Characterization and expression patterns of the MAPK family in zebrafish, 1019-1026, Copyright (2006) with permission from Elsevier. Full text @ Gene Expr. Patterns