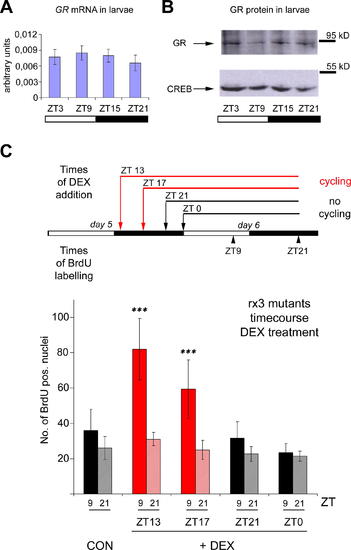
Shorter-Term Treatment with Dexamethasone Also Rescues Cell Cycle Rhythms in Strong rx3 Mutants (A and B) Expression analysis of the zebrafish GR. (A) GR mRNA expression as determined by quantitative RT-PCR in wild-type larvae at four circadian time points. No significant oscillation is apparent (one-way ANOVA [analysis of variance], p = 0.4231). Error bars show the 95% confidence interval of the mean from three independent experiments. As a control, per4 mRNA levels were assayed in the same samples and shown to exhibit a high-amplitude rhythm (unpublished data; see also Figure2A). (B) Representative Western blot showing expression levels of the GR protein (upper) and of CREB (lower) as a loading control. Consistent with mRNA expression levels, no overt oscillation can be observed. (C) Upper panel: experimental design to define a minimum period of exposure to the tonic dexamethasone (DEX) signal required to rescue cell cycle rhythms in the rx3 mutants. Black and white bars represent the light and dark periods of day 5 and 6 post-fertilization. Above: times of DEX addition to the medium. Red arrows and lines indicate treatments that are able to increase the cycling amplitude of BrdU incorporation in strong rx3 mutant larvae, whereas black arrows and lines indicate those that fail to do so. Below: times for BrdU labeling (as 15-min pulses) and harvesting on day 6 (indicated as ZT time points). Lower panel: quantification of BrdU incorporation in strong rx3 mutants following the treatments outlined in the upper panel. Peak (ZT9, dark color) and trough (ZT21, light color) mean values on day 6 are shown for untreated controls (CON) and the four times of DEX addition on day 5 (+DEX). Red bars: treatments that result in a significant difference between peak and trough values (Mann-Whitney-Test; ***, p < 0.001), black bars: no significant differences observed between peak and trough values. Error bars indicate the 95% confidence interval of the mean. Data are pooled from six independent experiments.
|

