
FIGURE
Fig. S2
Fig. S2
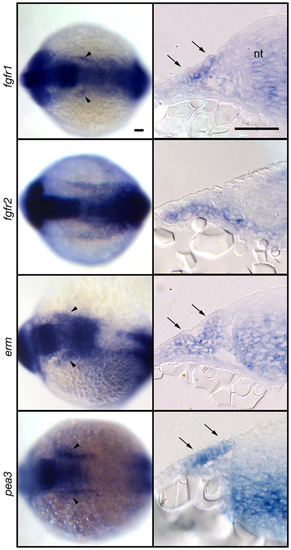
Fgf signaling is active in EB placode at the time of induction. Expression analyses of fgfr1, fgfr2, erm and pea3 at 13-14 hpf. Whole-mount panels (left) are dorsal views of the embryos; transverse sections (right) are at the level of r2-r4. Notice expression of these markers just lateral to the neural tube (arrowheads). Transverse sections revealed ectodermal expression of fgfr1, erm, and pea3 (arrows). Scale bars: 50 μm. |
Expression Data
| Genes: | |
|---|---|
| Fish: | |
| Anatomical Term: | |
| Stage: | 5-9 somites |
Expression Detail
Antibody Labeling
Phenotype Data
Phenotype Detail
Acknowledgments
This image is the copyrighted work of the attributed author or publisher, and
ZFIN has permission only to display this image to its users.
Additional permissions should be obtained from the applicable author or publisher of the image.
Full text @ Development