Fig. 2
- ID
- ZDB-FIG-061219-10
- Publication
- Zhong et al., 2006 - Vertebrate MAX-1 is required for vascular patterning in zebrafish
- Other Figures
- All Figure Page
- Back to All Figure Page
|
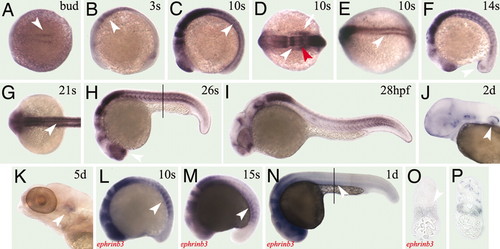
Expression pattern of zebrafish max-1 and eprhinb3 detected by in situ hybridization. Embryos are anterior to the left and dorsal to the top, except in A, D, E, and G, which are dorsal views with anterior to the left. O and P are transverse sections through the trunk shown in N and H, respectively. A?K and P show max-1 in situ hybridization; L?O show ephrinb3 in situ hybridization. (A) Bud stage. The white arrowhead points to the max-1 expression region near the tail bud. (B) The 3-somites stage. The white arrowhead indicates the prospective hindbrain. (C) The 10-somites stage. The white arrowhead points to the somites. (D) The 10-somites stage (dorsal view). The white arrowhead points to the first rhombomere, and the red arrowhead indicates the third rhombomere. The white arrow points to the otic placode. (E) The 10-somites stage (dorsal view). The white arrowhead points to the somites. (F) The 14-somites stage. The white arrowhead indicates the epithelial tissue at the edge of the tail bud. (G) The 21-somites stage. The white arrowhead points to the dorsal midline. (H) The 26-somites stage. The white arrowhead points to the mouth. (I) The 28-hpf stage. (J) The 2-dpf stage. The white arrowhead points to the pectoral fin bud. (K) The 5-dpf stage. The white arrowhead points to the ear. (L) The 10-somites stage (ephrinb3 expression pattern). The white arrowhead points to the somites. (M) The 15-somites stage (ephrinb3 expression pattern). The white arrowhead points to the somites. (N) The 1-dpf stage (ephrinb3 expression pattern). The white arrowhead points to the ventral somites. (O) The 1-dpf stage (ephrinb3 expression pattern). Shown is a transverse section through the plate in N. The white arrowhead points to the ventral somites. (P) The 26-somites stage (max-1 expression pattern). Shown is a transverse section through the plate in H. |
| Genes: | |
|---|---|
| Fish: | |
| Anatomical Terms: | |
| Stage Range: | Bud to Day 5 |

