
FIGURE
Fig. 5
- ID
- ZDB-FIG-060203-15
- Publication
- Bollig et al., 2006 - Identification and comparative expression analysis of a second wt1 gene in zebrafish
- Other Figures
- All Figure Page
- Back to All Figure Page
Fig. 5
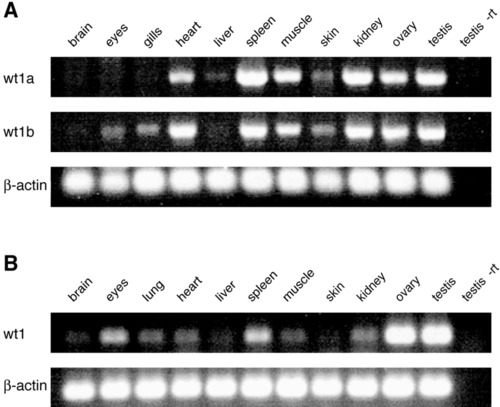
A,B: Expression of wt1 in adult tissues. Indicated organs were isolated from 6 month old zebrafish (A) and mice (B). Wt1 expression levels were determined by RT-PCR. Fragment sizes for zebrafish wt1 were identical to those in Figure 3. In case of the mouse tissues, the wt1 amplicon comprised 194 bp and the β-actin amplicon 165 bp. To verify the absence of genomic DNA contamination, an aliquot of the testis RNA sample from zebrafish and mouse was used for polymerase chain reaction without reverse transcription (-rt). |
Expression Data
| Genes: | |
|---|---|
| Fish: | |
| Anatomical Terms: | |
| Stage: | Adult |
Expression Detail
Antibody Labeling
Phenotype Data
Phenotype Detail
Acknowledgments
This image is the copyrighted work of the attributed author or publisher, and
ZFIN has permission only to display this image to its users.
Additional permissions should be obtained from the applicable author or publisher of the image.
Full text @ Dev. Dyn.