
FIGURE
Fig. 2
- ID
- ZDB-FIG-050516-1
- Publication
- Nicoli et al., 2005 - Regulated expression pattern of gremlin during zebrafish development
- Other Figures
- All Figure Page
- Back to All Figure Page
Fig. 2
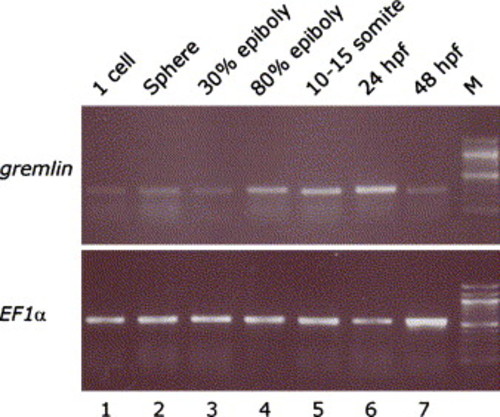
grm expression during zebrafish development, shown by RT-PCR performed on RNA extracted from harvested embryos, from 1-cell to 48 hpf stages (lanes 1?7). Elongation factor 1α (EF1α) serves as a loading control. |
Expression Data
| Gene: | |
|---|---|
| Fish: | |
| Anatomical Term: | |
| Stage Range: | 1-cell to Long-pec |
Expression Detail
Antibody Labeling
Phenotype Data
Phenotype Detail
Acknowledgments
This image is the copyrighted work of the attributed author or publisher, and
ZFIN has permission only to display this image to its users.
Additional permissions should be obtained from the applicable author or publisher of the image.
Reprinted from Gene expression patterns : GEP, 5(4), Nicoli, S., Gilardelli, C.N., Pozzoli, O., Presta, M., and Cotelli, F., Regulated expression pattern of gremlin during zebrafish development, 539-544, Copyright (2005) with permission from Elsevier. Full text @ Gene Expr. Patterns