
Fig. 1
- ID
- ZDB-FIG-050107-1
- Publication
- Rentzsch et al., 2003 - Specific and conserved roles of TAp73 during zebrafish development
- Other Figures
- All Figure Page
- Back to All Figure Page
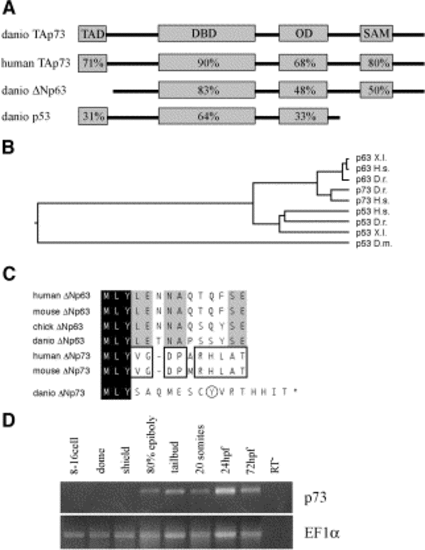
Structure of zebrafish p73 and its temporal expression profile. (A) Homology of zebrafish p73 compared to other members of this gene family. Percentages indicate amino acid identity within the respective domains. TAD, transactivating domain; DBD, DNA-binding domain; OD, oligomerization domain; SAM, sterile alpha motif. (B) Phylogenetic tree (neighbor joining method) based on an alignment of the DNA-binding domains using ClustalW (MegAlign software). X.l., Xenopus laevis; H.s., Homo sapiens; D.r., Danio rerio; D.m., Drosophila melanogaster (C) Alignment of the N-termini of known ΔNp63 and ΔNp73 proteins and a putative ΔNp73 from zebrafish. Residues shared by all ΔN isoforms are shown inverted, residues conserved in all ΔNp63 orthologues are shaded and those shared by ΔNp73 orthologues are boxed. The last residue before the in-frame splice donor site is encircled. (D) Temporal expression profile of p73 as determined by RT-PCR, with EF1α as control. |
| Gene: | |
|---|---|
| Fish: | |
| Anatomical Term: | |
| Stage Range: | 75%-epiboly to Protruding-mouth |
Reprinted from Gene, 323, Rentzsch, F., Kramer, C., and Hammerschmidt, M., Specific and conserved roles of TAp73 during zebrafish development, 19-30, Copyright (2003) with permission from Elsevier. Full text @ Gene