
Fig. 4
- ID
- ZDB-FIG-220905-27
- Publication
- Kowatschew et al., 2022 - Spatial organization of olfactory receptor gene choice in the complete V1R-related ORA family of zebrafish
- Other Figures
- All Figure Page
- Back to All Figure Page
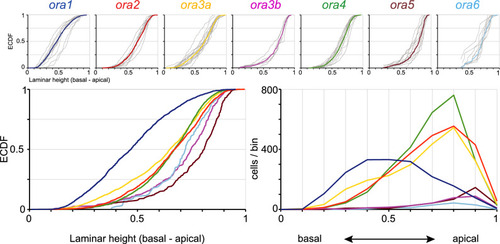
Quantitative assessment of laminar height distributions of ora-expressing neurons. Laminar height of ora-expressing cells was quantified for all seven ora genes. Complete series of sections from five to fifteen olfactory epithelia were evaluated for each ora gene. Height within the lamina was normalized to maximal laminar thickness at the position of the cell. Upper row: The resulting distributions of relative laminar height (from 0, most basal to 1, most apical, i.e., bordering to the lumen) are shown unbinned (ECDF). Light grey curves represent the distribution for individual olfactory organs, colored curves represent the cumulative distribution for the respective genes. The color code for the ora genes is the same as in other figures to facilitate comparisons between different positional parameters. Lower row: Overlay of the seven distributions shown individually in upper row, both as ECDF (left panel) and histogram (right panel). Different genes exhibit different centers-of-gravity (mean) and different skewness. |