
- Title
-
Spatial organization of olfactory receptor gene choice in the complete V1R-related ORA family of zebrafish
- Authors
- Kowatschew, D., Bozorg Nia, S., Hassan, S., Ustinova, J., Weth, F., Korsching, S.I.
- Source
- Full text @ Sci. Rep.
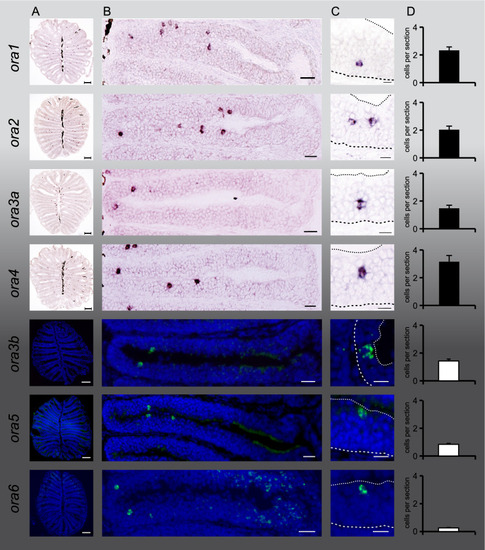
Expression of all seven ora genes in sparsely distributed cells in the olfactory epithelium. Horizontal sections of adult zebrafish olfactory epithelia were hybridized with probes for all seven ora genes, as indicated. Chromogenic detection by NBT/BCIP for ora1, ora2, ora3a and ora4, fluorigenic detection with TSA for ora3b, ora5, and ora6. Column (A) shows representative complete sections labeled with the respective probes. Column (B), higher magnifications of a single lamella from different sections. All panels have the same orientation, center (median raphe) to the left and periphery to the right. Note that for better visualization sections with above average frequency were selected, thus values are higher than the average values shown in column (D). Column (C), higher magnification shows positions of single cells within the lamella. Coarse dashed lines depict the border to the basal lamina and fine dashed lines depict the apical border to the lumen, cf. Fig. 2. (A) Scale bars correspond to 100 µm, (B) scale bars 20 µm (30 µm for ORA1), (C) scale bars 10 μm. Column (D), bar graphs show number of labeled cells per section for each ora gene (mean +/− SEM, for number of sections analysed see SI Fig. 1). EXPRESSION / LABELING:
|
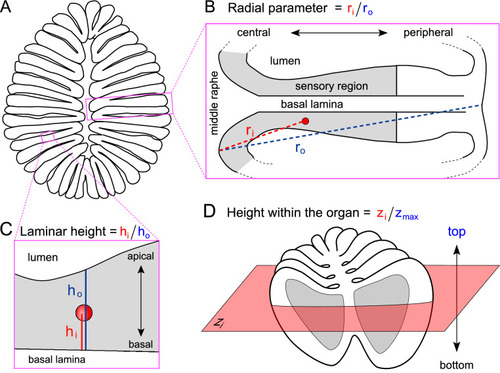
Schematic representation of spatial coordinates measured. (A) Horizontal cross section of an olfactory epithelium. (B) Enlargement shows the radial parameter (ri), measured from middle raphe between lamellae to center of labeled cell and normalized to maximal radius (ro, including non-sensory area). One lamella is shown. (C) Enlargement shows the laminar height parameter (hi), measured from the border between basal lamina and the sensory layer to center of labeled cell and normalized to maximal height (ho, measured at position of labeled cell, as laminar height varies throughout the lamella). (D) The complete olfactory organ, all three spatial coordinates are shown. height-within-the-organ is measured as section number z, beginning with the most basal section still containing sensory surface (bottom to top). |
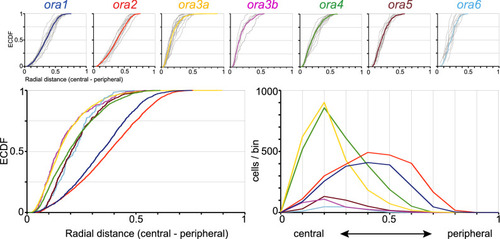
Quantitative analysis of radial position shows three subgroups of ora genes. Radial positions of ora-expressing cells were quantified for all seven ora genes. Complete series of sections from five to fifteen olfactory epithelia were evaluated for each ora gene. Radial position within the section was normalized to maximal radius, i.e., length of the lamella containing the respective labeled cell. Upper row: The resulting distributions of relative radius (from 0, innermost to 1, outermost) are shown unbinned (ECDF). Light grey curves represent the distribution for individual olfactory organs, colored curves represent the cumulative distribution for the respective genes. The color code for the ora genes is the same as in later figures to facilitate comparisons between different positional parameters. Lower row: Overlay of the seven distributions shown individually in upper row, both as ECDF (left panel) and histogram (right panel). Different genes exhibit different centers-of-gravity (mean) and different skewness. Note a segregation in three groups, with ORA3a and ORA3b in a central group, ORA1 and ORA2 in a peripheral group and the remaining three receptors in an intermediate group. |
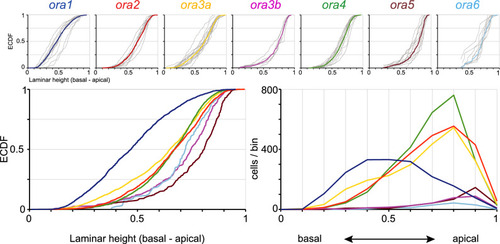
Quantitative assessment of laminar height distributions of ora-expressing neurons. Laminar height of ora-expressing cells was quantified for all seven ora genes. Complete series of sections from five to fifteen olfactory epithelia were evaluated for each ora gene. Height within the lamina was normalized to maximal laminar thickness at the position of the cell. Upper row: The resulting distributions of relative laminar height (from 0, most basal to 1, most apical, i.e., bordering to the lumen) are shown unbinned (ECDF). Light grey curves represent the distribution for individual olfactory organs, colored curves represent the cumulative distribution for the respective genes. The color code for the ora genes is the same as in other figures to facilitate comparisons between different positional parameters. Lower row: Overlay of the seven distributions shown individually in upper row, both as ECDF (left panel) and histogram (right panel). Different genes exhibit different centers-of-gravity (mean) and different skewness. |

ora4-expressing cells show preferential expression in the top of the olfactory organ. Quantitative assessment of distribution of ora-expressing neurons along the vertical z-axis (height-within-the-organ). Height within the olfactory organ was quantified as section number in a series of horizontal sections, and normalized to the total number of sections containing sensory epithelium, using the same set of cells, for which laminar height was determined. Relative height-within-the-organ ranges from 0 (bottommost section) to 1 (top section, near to the opening of the bowl-shaped olfactory organ). Upper row: The resulting distributions are shown unbinned (ECDF). Light grey curves represent the distribution for individual olfactory organs, colored curves represent the cumulative distribution for the respective genes. The color code for the ora genes is the same as in other figures to facilitate comparisons between different positional parameters. Lower row: Overlay of the distributions shown individually in the upper row, both as ECDF (left panel) and histogram (right panel). Due to lower resolution (all cells within one 10 µm section are assigned to a single z value) the ECDF curves appear ragged. |

Multidimensional analysis of spatial expression patterns shows significantly different expression zones for all ora genes and clear segregation from two other olfactory receptor families. (A) Comparison of spatial distribution parameters between ora genes. Schematic representation of spatial distributions for all ora genes by ellipses ranging from the 1st to the 3rd quartile value for radial (x axis) and laminar height (y axis) parameter. Color code for ora genes as before. (B) Comparison of distributions for ora versus olfC and odorant receptor (or) genes using the same coordinates and representation as in (A). Note that the color code is changed compared to panel (A). The raw data for olfC genes are taken from11, raw data for the radial parameter of or genes are from7. For names and quartile values of or and olfC genes see SI Table 1. (C,D) Distributions of ora-expressing OSNs intercalate between those of other olfactory receptor families. Distributions are shown as ECDFs. Red lines, ora genes; black, olfC genes; blue, or genes. Panel (C) shows the distribution for the radial coordinate, panel (D) depicts the laminar height parameter. |