
FIGURE
Fig. 3
- ID
- ZDB-FIG-220627-29
- Publication
- Della Vecchia et al., 2022 - Trehalose Treatment in Zebrafish Model of Lafora Disease
- Other Figures
- All Figure Page
- Back to All Figure Page
Fig. 3
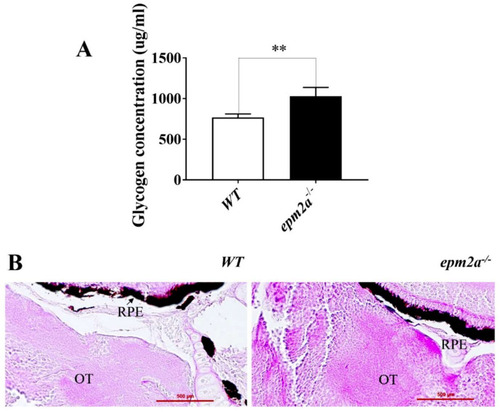
Accumulation of glycogen in epm2a−/− larvae at 5 dpf. (A) Glycogen concentration, expressed in ug/mL, measured in epm2a−/− larvae (n = 30) and WT controls (n = 30) at 5 dpf. The values are expressed as mean ± standard deviation (SD). **, p ≤ 0.01, calculated by Student’s t-test. (B) Histological examination with periodic acid-Schiff staining of the brains of epm2a−/− and WT larvae at five dpf (magnification 40×). Abbreviations: OT, optic tectum; RPE, retinal pigment epithelium. |
Expression Data
Expression Detail
Antibody Labeling
Phenotype Data
| Fish: | |
|---|---|
| Observed In: | |
| Stage: | Day 5 |
Phenotype Detail
Acknowledgments
This image is the copyrighted work of the attributed author or publisher, and
ZFIN has permission only to display this image to its users.
Additional permissions should be obtained from the applicable author or publisher of the image.
Full text @ Int. J. Mol. Sci.