
- Title
-
Gut Bacterial Metabolites from Tryptophan and Phenylalanine Induce Melatonin Synthesis and Extend Sleep Duration in Mice
- Authors
- Lee, J.H., Hwang, S.J., Ham, S.L., Kim, J., Bang, H.J., Park, J.S., Jang, H.H., Kim, T.Y., Park, J.W., Seo, Y.R., Kim, B.S., Kim, G.S., Lee, H.J., Kim, C.S.
- Source
- Full text @ ACS Omega

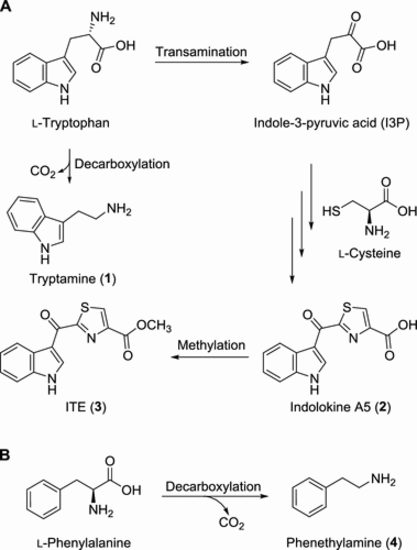
Identification of metabolites from gut bacterial cultures. (A) Structures of melatonin and the gut bacterial metabolites (1?4). (B) HPLC analysis of tryptamine (1) and phenethylamine (4) from bacterial culture extracts (top), isolation (middle), and authentic standards (bottom). |
Proposed biosynthesis of gut bacterial metabolites 1?3 (A) and 4 (B). |

Evaluation of the sleep-promoting effects of 1?4 in a pentobarbital-induced sleep mouse model. (A) The experimental procedure for the pentobarbital-induced sleep test method. (B?D) The effect of compounds 1?4 on sleep latency (B), sleep duration (C), and blood melatonin concentration (D) in mice treated with pentobarbital. Error bars represent the mean � SD. Significance was evaluated using a t-test. Significance levels are indicated as *p < 0.05, **p < 0.01, and ***p < 0.005, compared to the control (CONT.). |

Assessment of in vivo toxicity of ITE (3) and PEA (4). (A) At the 48 hpf, illustrative photomicrographs were acquired. (B) Zebrafish heartbeat per min. (C) Zebrafish phenotype, classified as normal trunk (NT), trunk deformation (TD), NT with hemorrhage (H), TD with H, and death, was quantified to represent the quantity of zebrafish embryos (n = 30). |
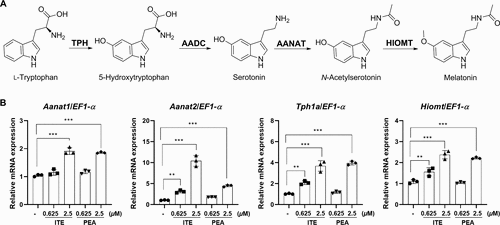
Evaluation of the effects of ITE (3) and PEA (4) on melatonin biosynthesis. (A) Characterization of the biosynthetic pathway of melatonin. (B) The enhancing effects of ITE (3) and PEA (4) on melatonin biosynthesis in zebrafish embryos. The relative expression levels of Aanat1, Aanat2, Tph1a, and Hiomt mRNA in zebrafish embryos treated with 0.625 or 2.5 ?M ITE (3) and PEA (4). Results are presented as means � SD (n = 3). Statistical significance was determined using one-way ANOVA followed by multiple comparison tests. Significance levels are indicated as **p < 0.05, and ***p < 0.001. |