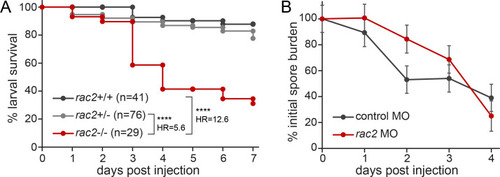
Rac2-deficient zebrafish larvae are susceptible to A. fumigatus infection. (A) rac2+/− adult fish were crossed to each other, and the resulting larvae were injected with TBK1.1 (Af293) spores. Survival was monitored for 7 dpi, and larvae were genotyped at the conclusion of the experiment. Average injection CFUs = 46. Data represent three pooled replicates. P values and hazard ratios were calculated by Cox proportional hazard analysis. (B) Larvae previously treated with rac2 or standard control MO were injected with TBK1.1 (Af293) spores. At 0–5 dpi, larvae were homogenized and plated to evaluate CFUs. CFU counts were normalized to the average injection dose for each group for each replicate. CFUs were evaluated from four to eight larvae per group per day per replicate. Average injection CFUs: control = 46, rac2 = 56. Plotted data represent emmeans ± SEM from four pooled experiments; P values were calculated by analysis of variance (ANOVA).

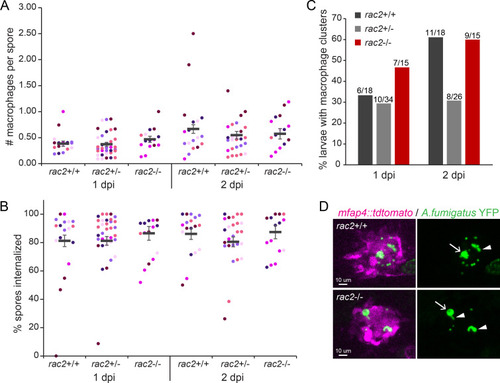
Rac2 is not required for macrophage migration to or phagocytosis of A. fumigatus spores. rac2+/−; mfap4::tdtomato adult fish were crossed to each other, and the resulting larvae were injected with YFP-expressing TBK1.1 (Af293) spores. Larvae were live imaged via confocal microscopy at 1 and 2 dpi and genotyped at the conclusion of the experiment. Average number of spores enumerated per larva via microscopy at 1 dpi = 60. Data represent 6 pooled replicates of 10–13 larvae per replicate. (A and B) The number of macrophages (mfap4::tdtomato) at the infection site and the number of spores present were counted, and the average number of macrophages per spore (A) and the percentage of spores found inside of macrophages (B) were calculated. Each symbol represents one larva, color coded by experiment. Lines represent emmeans ± SEM. P values calculated by ANOVA. (C) The presence of macrophage clusters was evaluated, and the percentage of larvae across all replicates with clusters is plotted. P values calculated by Fisher’s exact test. (D) Example images showing macrophage clustering around fungi. Both spore swelling (arrow) and germination (arrowhead) can be found from inside of macrophage clusters.

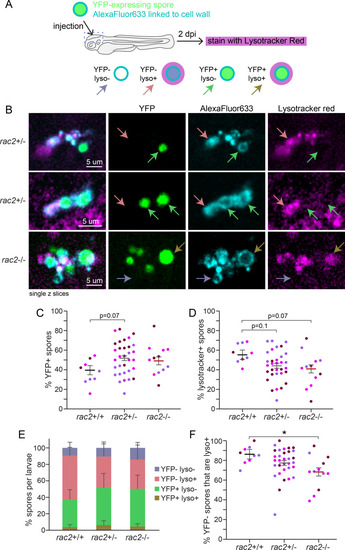
Rac2 is not required for spore acidification or killing. rac2+/− adult fish were crossed to each other, and the resulting larvae were injected with YFP-expressing and AlexaFluor633-cell wall-conjugated TBK1.1 (Af293) spores. At 2 dpi, larvae were stained with Lysotracker Red and live imaged and then genotyped. Average number of spores enumerated per larva via microscopy at 2 dpi = 40. Data represent 3 pooled replicates of 17–18 larvae per replicate. (A) Experimental schematic. (B) Example images showing killed spores in non-acidified compartments (YFP−, AF+, lyso−; purple arrow), killed spores in acidified compartments (YFP−, AF+, lyso+; pink arrow), alive spores in non-acidified compartments (YFP+, AF+, lyso−; green arrow), and alive spores in acidified compartments (YFP+, AF+, lyso+; brown arrow). Each image shows a single z slice from a confocal image stack. (C) The percentage of alive (YFP+) spores was calculated for each larva. (D) The percentage of spores present in acidified compartments (lyso+) was calculated for each larva. (E) The average percentage of spores in each type of compartment was calculated across all larvae. (F) The percentage of killed (YFP−) spores that are found in acidified compartments (lyso+) was calculated for each larva. For (C, D, and F) each symbol represents one larva, color coded by replicate. For C–F, lines represent emmeans ± SEM. P values were calculated by ANOVA.

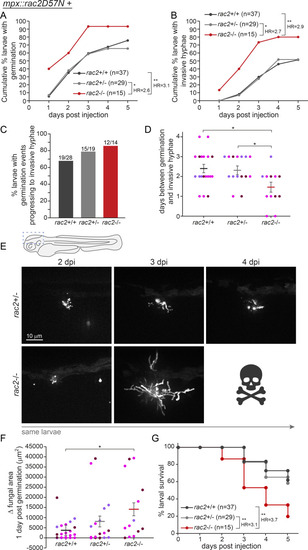
Macrophages control spore germination and extracellular hyphal growth through Rac2 function. rac2+/–; mpx::mCherry-2A-rac2D57N adult fish were crossed to each other, and the resulting larvae were injected with YFP-expressing TBK1.1 (Af293) spores. Larvae were live imaged via confocal microscopy at 1–5 dpi and genotyped at the conclusion of the experiment. All larvae in the experiment carry the mpx::rac2D57N transgene. Data represent 3 pooled replicates of 22–31 larvae per replicate. (A and B) The cumulative percentage of larvae experiencing germination (A) and invasive hyphae (B) was calculated. P values and hazard ratios were calculated by Cox proportional hazard analysis. (C) Of larvae experiencing germination, the percentage that progress to invasive hyphae was calculated. P values calculated by Fisher’s exact test. (D) Of larvae that experience germination and invasive hyphae, the number of days between the observance of these forms of growth was calculated. Each symbol represents one larva, color coded by experiment; lines represent emmeans ± SEM. P values calculated by ANOVA. (E) Example images showing germination in larvae at 2 dpi and subsequent control of fungal growth (top) or invasive hyphae development and death (bottom). (F) In larvae that experience germination, the fungal (YFP+) area was measured at both 0 and 1 dpg. Each symbol represents one larva, color coded by experiment; lines represent emmeans ± SEM. P values calculated by ANOVA. (G) Survival of larvae was monitored for the 5 days of imaging. P values and hazard ratios calculated by Cox proportional hazard analysis.

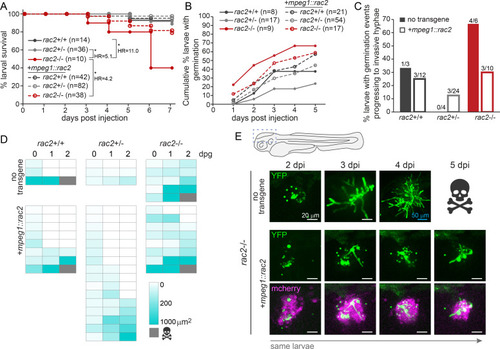
Macrophage-expressed Rac2 is sufficient to promote host survival against invasive A. fumigatus growth. rac2+/− and rac2+/−; mpeg1::mCherry-2A-rac2 adults were crossed to each other, and the resulting larvae were injected with YFP-expressing TBK1.1 (Af293) spores. (A) Survival was monitored for 7 dpi, and larvae were genotyped at the conclusion of the experiment for both the endogenous rac2 genotype and presence of the transgene. Average injection CFUs = 45. Data represent three pooled replicates. P values and hazard ratios were calculated by Cox proportional hazard analysis. (B–E) Larvae were live imaged via confocal microscopy at 1–5 dpi and genotyped at the conclusion of the experiment. Data represent 3 pooled replicates of 42 larvae per replicate. (B) The cumulative percentage of larvae experiencing germination was calculated. P values and hazard ratios calculated by Cox proportional hazard analysis. (C) Of larvae experiencing germination, the percentage that progress to invasive hyphae was calculated. P values calculated by Fisher’s exact test. (D) Fungal (YFP+) areas 0, 1, and 2 dpg were measured in larvae that experience germination at 3 dpi and displayed in a heatmap. (E) Example images showing germination in larvae at 3 dpi and subsequent invasive hyphae development and death (top) or control of fungal growth in larvae re-expressing Rac2 and mCherry in macrophages (bottom).

Acknowledgments
This image is the copyrighted work of the attributed author or publisher, and ZFIN has permission only to display this image to its users. Additional permissions should be obtained from the applicable author or publisher of the image. Full text @ Infect. Immun.