FIGURE SUMMARY
Title

Retinal degeneration in rpgra mutant zebrafish

Authors
Liu, X., Han, S., Liu, F., Yu, S., Qin, Y., Li, J., Jia, D., Gao, P., Chen, X., Tang, Z., Liu, M., Huang, Y.
Source
Full text @ Front Cell Dev Biol

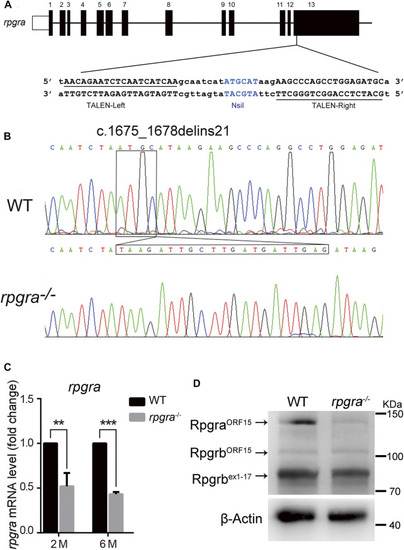
Generation of the rpgra mutant zebrafish. (A) The 13 exons of zebrafish rpgra are shown with the left and right arms of the TALEN binding sequences underlined. TALEN-L and TALEN-R, the left and right arms of the TALENs binding sequences; the NsiI restriction site in the spacer region is used for mutation detection. (B) Sequencing of the c.1675_1678delinsTAAGATTGCTTGATGATTGAG rpgra mutation in homozygous zebrafish. The DNA base change was indicated with a box. (C)rpgra mRNA levels in 2- and 6-month-old WT and rpgra−/− zebrafish eyes detected by quantitative PCR. Actb1 served as endogenous control. The result was shown as mean ± SD. **, 0.001 < p < 0.01; ***, p < 0.001. (D) Rpgra protein levels of WT and rpgra−/− zebrafish at 2mpf were revealed by Western blot using the anti-RPGR antibody.

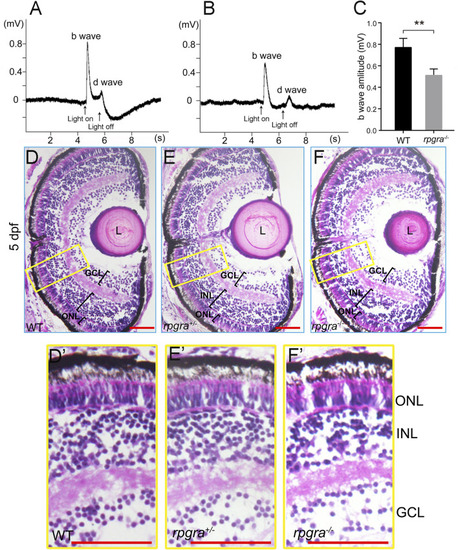
Visual impairment in the rpgra−/− larval zebrafish. (A) Detection of visual function by ERG analysis of WT zebrafish at 5 dpf. (B) Detection of visual function by ERG analysis of rpgra−/− zebrafish at 5 dpf. (C) Comparison of b-wave amplitudes between WT (n = 5) and rpgra−/− (n = 6) zebrafish using two-tailed Student’s t-test. The result is shown as mean ± SD. **, p < 0.01. (D–F) Histological analyses of WT, rpgra+/−, and rpgra−/− zebrafish at 5dpf. Cryosections were stained with hematoxylin and eosin. (D′–F′) Enlarged images of the area inside the yellow box in the (D–F). ONL, outer nuclear layer; INL, inner nuclear layer; GCL, ganglion cell layer; L, Lens. Scale bars, 50 µm.

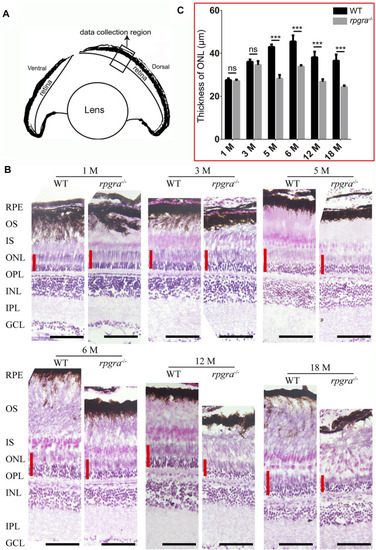
Retinal degeneration in rpgra−/− zebrafish revealed by histologic analysis. (A) Schematic showing the data collected region of WT or rpgra−/− retina. (B) Retinal sections from the dark-adapted WT and rpgra−/− zebrafish stained with hematoxylin and eosin (H&E). The red lines indicate the thicknesses of the ONL. RPE, retinal pigment epithelium; OS, outer segment; IS, inner segment; ONL, outer nuclear layer; OPL, outer plexiform layer; INL, inner nuclear layer; IPL, inner plexiform layer; GCL, ganglion cell layer. Scale bars, 50 μm. (C) Statistical results of the thickness of the retinal outer nuclear layer in each month’s zebrafish (n = 8) were analyzed using a two-tailed Student’s t-test and shown as mean ± SD. **, 0.001 < p < 0.01; ***, p < 0.001.

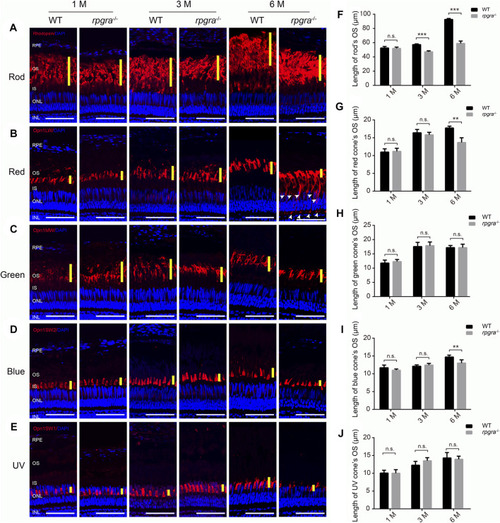
Photoreceptor outer segment is affected in rpgra−/− zebrafish. Retinal cryosections from WT and rpgra−/− zebrafish were labeled rods (A), red cones (B), green cones (C), blue cones (D), and UV cones (E), with specific antibodies at the ages of 1, 3, and 6 months. The yellow lines indicate the thickness of the outer segment layer of the photoreceptor; the white arrows indicate the mistrafficked Opn1lw1 protein. RPE, retinal pigment epithelium; OS, outer segment; IS, inner segment; ONL, outer nuclear layer; INL, inner nuclear layer. Scale bars, 50 μm. The statistical data are presented in (F) for rods and (G–J) for cones. At least three images from three eyes of each group were quantified and analyzed using a two-tailed Student’s t-test. The results are shown as mean ± SD. **, p < 0.01; ***, p < 0.001.

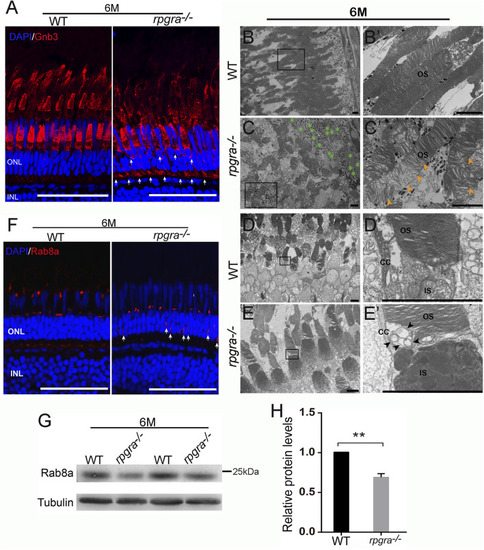
Abnormal ciliary trafficking in rpgra−/− zebrafish photoreceptors. (A) Retinal cryosections from WT and rpgra−/− zebrafish were labeled Gnb3 with specific antibodies at the ages of 6 mpf. Scale bars, 50 μm. (B) Well-maintained outer segments (OS) from WT retina. (B′) Enlarged image of the box in (B). Scale bars, 5 μm. (C) Disorganized and loosely arranged outer segment membrane disc in rpgra−/− zebrafish retina. Green asterisks, Lipid droplet. (C′) Enlarged image of the box in (C). The yellow arrows show a large number of loosely arranged outer segment membrane discs. Scale bars, 5 μm. (D) The complete structure of connecting cilia without the accumulation of abnormal objects in WT photoreceptor cells. (E) Obvious accumulation of transport vesicles in the connective cilia of the rpgra−/− photoreceptor cells. (D′, E′) Enlarged images of the boxes in (D, E). The black arrows indicate the accumulated vesicles. CC, connecting cilia; OS, outer segment; IS, inner segment; Scale bar, 5 μm. (F) Immunofluorescence showed that Rab8A protein in 6-month-old rpgra−/− zebrafish is mislocated in photoreceptor cells. The arrow marks the mislocated signals; Scale bar, 50 μm. (G) Protein levels of Rab8a were detected by Western blot at the age of 6mpf. (H) Statistical result of Rab8a protein expression level. The quantitative data of five independent experiments were statistically analyzed using a two-tailed Student’s t-test and shown as mean ± SD. **, p < 0.01.

Acknowledgments
This image is the copyrighted work of the attributed author or publisher, and ZFIN has permission only to display this image to its users. Additional permissions should be obtained from the applicable author or publisher of the image. Full text @ Front Cell Dev Biol