
- Title
-
Localized Infections with P. aeruginosa Strains Defective in Zinc Uptake Reveal That Zebrafish Embryos Recapitulate Nutritional Immunity Responses of Higher Eukaryotes
- Authors
- Secli, V., Di Biagio, C., Martini, A., Michetti, E., Pacello, F., Ammendola, S., Battistoni, A.
- Source
- Full text @ Int. J. Mol. Sci.
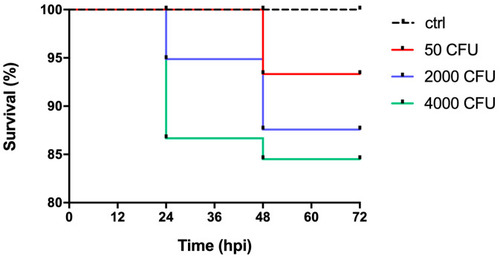
Zebrafish survival to P. aeruginosa infections. Kaplan?Meier survival curves of zebrafish embryos microinjected in the pericardial cavity as described in Section 4.2, with increasing doses of PA14 wild-type or PBS alone (ctrl). The survival was calculated as a percentage of the total injected embryos (n = 15) for each treatment group and was monitored at post infections time intervals (hpi). Data were obtained from one experiment representative of three independent experiments. PHENOTYPE:
|
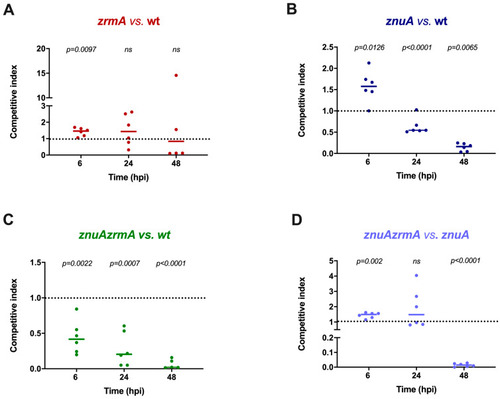
Competition assays of P. aeruginosa strains in zebrafish embryos. (A) Competition between zrmA (strain A) and wild-type (strain B). (B) Competition between znuA (strain A) and wild-type (strain B). (C) Competition between znuAzrmA (strain A) and wild-type (strain B). (D) Competition between znuAzrmA (strain A) and znuA (strain B). Each data point represents the competitive index calculated, as described in Section 4.3, on a homogenate of 6 pooled animals. A horizontal straight line indicates the median CI value calculated on the CI values of independent experiments. Statistical analyses were performed by the Student?s t-test (ns, not significant). |

Expression levels of slc30 genes from zebrafish infected with P. aeruginosa. RT-PCR was performed on mRNA extracted from infected zebrafish at 6, 24, and 48 hpi. The dotted line at Y = 1 is the expression level of the genes in uninfected animals (control). Data are means � SD of three independent experiments, and statistical analyses were carried out by two-way ANOVA and Tukey?s multiple comparison test. Asterisks show statistical differences versus uninfected zebrafish (**** p < 0.0001; *** p < 0.0005; * p < 0.05), and hash signs show statistical differences between 24 hpi and 48 hpi for slc30a4, and between 6 hpi and 48 hpi for slc30a7 (# p < 0.05). |
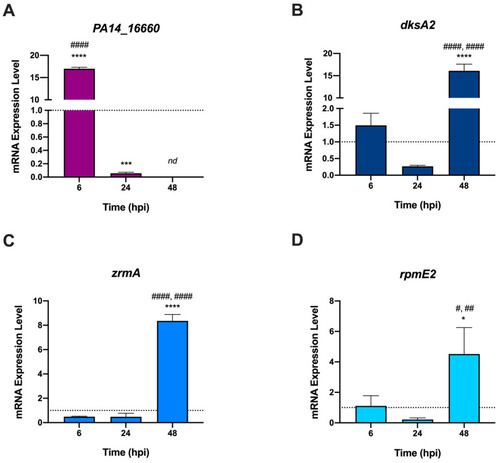
Expression levels of P. aeruginosa genes from infected zebrafish. RT-PCR was performed on bacterial mRNA extracted from zebrafish at 6, 24, and 48 hpi. The dotted line at Y = 1 represents the expression level of the genes in bacteria grown in LB medium (control). Data are means � SD of three independent experiments, and statistical analyses were performed by ordinary one-way ANOVA and Bonferroni?s multiple comparison test. Asterisks show statistical differences versus bacteria grown in LB medium (**** p < 0.0001; *** p < 0.0005; * p < 0.05), hash signs show statistical differences between samples at the different hpi (#### p < 0.0001; ## p < 0.001; # p < 0.05); nd: not detected. |