
- Title
-
Inflammatory response in hematopoietic stem and progenitor cells triggered by activating SHP2 mutations evokes blood defects
- Authors
- Solman, M., Blokzijl-Franke, S., Piques, F., Yan, C., Yang, Q., Strullu, M., Kamel, S.M., Ak, P., Bakkers, J., Langenau, D.M., Cave, H., den Hertog, J.
- Source
- Full text @ Elife
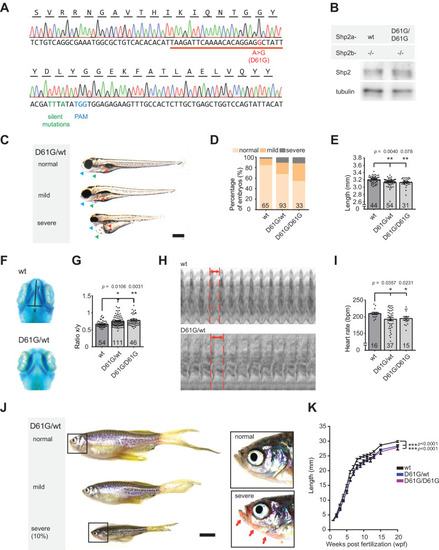
(A) Sequencing trace derived from Shp2D61G/D61G zebrafish. Oligonucleotide sequence used to generate the model is underlined. Nucleotide substitutions for D61G mutation (red), silent mutations close to the PAM site (green), and the PAM site (blue) are indicated. (B) Immunoblot of Shp2 levels from five pooled Shp2awtShp2b-/- or Shp2aD61G/D61GShp2b-/- embryos using antibodies for Shp2 and tubulin (loading control) (Figure 1?source data 1). (C) Representative images of typical Shp2D61G zebrafish embryonic phenotypes at 5 days post fertilization (dpf). Blue arrows: jaw, green arrows: heart, red arrows: swim bladder. (D) Quantification of phenotypes of Shp2wt, Shp2D61G/wt, and Shp2D61G/D61G embryos scored as in (C) normal, mild, and severe. (E) Body axis length of Shp2wt, Shp2D61G/wt, and Shp2D61G/D61G embryos at 5 dpf. (F) Representative images of Alcian blue-stained head-cartilage of 4dpf Shp2wt and Shp2D61G/wt embryos (x) width of ceratohyal, (y) distance to Meckel?s cartilage. (G) Quantified craniofacial defects (x/y ratio). (H) Representative ventricular kymographs derived from high-speed video recordings of beating hearts of 5 dpf Shp2wt and Shp2D61G/wt embryos. Red dotted lines indicate one heart period. (I) Heart rates derived from the ventricular kymographs. (J) Representative images of typical Shp2D61G zebrafish adult phenotypes at 24 weeks post fertilization (wpf). Red arrows indicate skin redness in the jaw region. Scale bar, 0.5 cm. Insets, zoom-in of boxed regions. (K) Body axis lengths of 10 Shp2wt, 25 Shp2D61G/wt, and 10 Shp2D61G/D61G zebrafish measured weekly between 5 dpf and 20 wpf of age. (D,E,G,I) Measurements originate from three distinct experiments. Number on bars: number of embryos. (E,G,I,K) Error bars: standard error of the mean (SEM), *p < 0.05; **p < 0.01, ***p < 0.001, ANOVA complemented by Tukey?s HSD.
|
( |
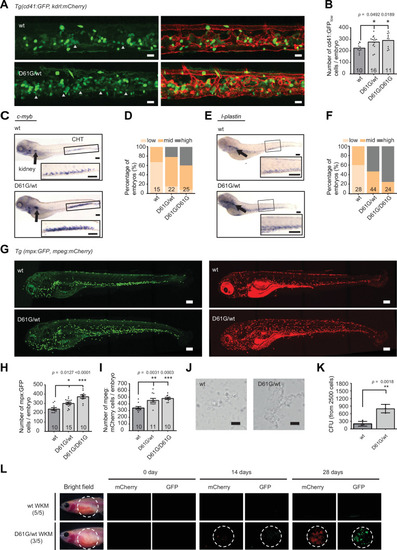
(A) Representative images of the caudal hematopoietic tissue (CHT) region of Shp2wt and Shp2D61G zebrafish embryos in Tg(cd41:GFP, kdrl:mCherry-CAAX) background at 5 days post fertilization (dpf). cd41:GFPlow cells mark hematopoietic stem and progenitor cells (HSPCs) and cd41:GFPhigh cells thrombocytes. Gray arrow heads indicate cd41:GFPlow cells. Scale bar, 20 ?m. (B) The low-intensity cd41:GFP-positive cells in the CHT region were counted. (C) Whole-mount in situ hybridization (WISH) of 5 dpf Shp2wt and Shp2D61G/wt embryos using c-myb-specific probe. Head kidney (arrow) and CHT (box) are indicated; zoom-in in inset. Scale bars, 150 ?m. (D) Quantification of c-myb WISH. C-myb expression in Shp2wt, Shp2D61G/wt, and Shp2D61G/D61G embryos was scored as low, mid, and high. (E) WISH of 5 dpf Shp2wt and Shp2D61G/wt embryos using l-plastin-specific probe. Head kidney (arrow) and CHT (box) are indicated and zoom-in in inset. Scale bars, 150 ?m. (F) Quantification of l-plastin expression in Shp2wt, Shp2D61G/wt, and Shp2D61G/D61G embryos scored as low, mid, and high. (G) Representative images of Shp2wt and Shp2D61G zebrafish embryos in Tg(mpx:GFP, mpeg:mCherry) background at 5 dpf. Mpx:GFP marks neutrophils and mpeg:mCherry macrophages. Scale bars, 150 ?m. (H,I) Number of mpx:GFP and mpeg:mCherry-positive cells per embryo. (J) Representative images of colonies developed from cd41:GFPlow cells isolated from the CHT of 5 dpf Shp2wt and Shp2D61G/wt zebrafish embryos, grown in methylcellulose with zebrafish cytokine granulocyte colony stimulating factor a (Gcsfa) for 2 days. Scale bar, 50 ?m. (K) Quantification of number of colonies from J, t-test. (L) WKM cells harvested from Shp2wt and Shp2D61G zebrafish in the Tg(mpx:GFP, mpeg:mCherry) background were injected into the peritoneum of adult prkdc-/- zebrafish. Recipients were monitored by fluorescence imaging. (B,D,F,H,I,K) Measurements originate from at least three distinct experiments. Number on bars: number of embryos. (B,H,I,K) Error bars represent SEM. *p < 0.05, **p < 0.01, ***p < 0.001. (B,H,I) ANOVA complemented by Tukey?s HSD.
|
( |
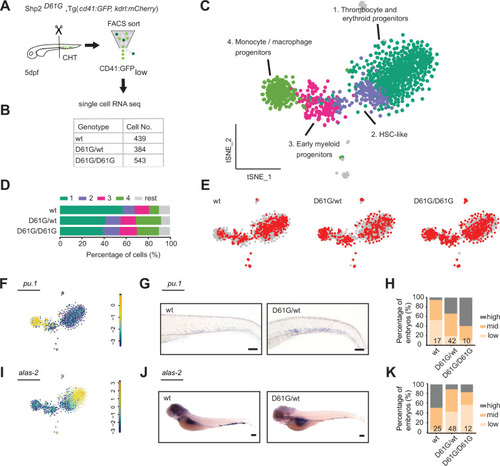
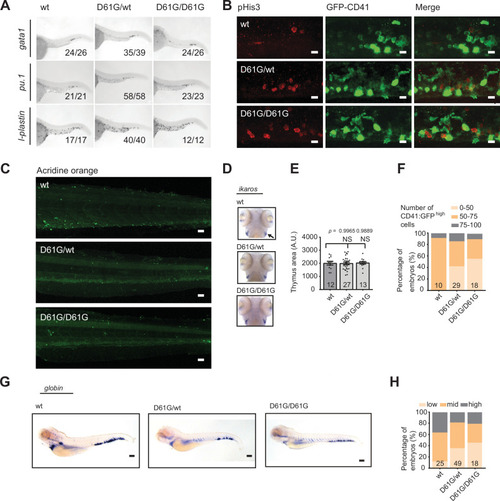
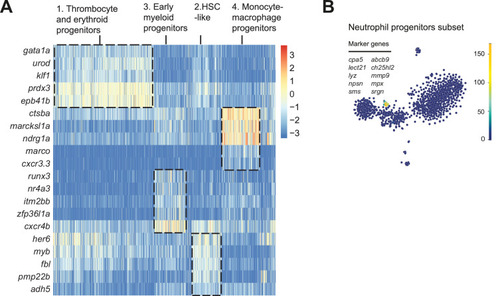
(A) Schematic representation of the experimental procedure. At 5 days post fertilization (dpf), caudal hematopoietic tissues (CHTs) from Shp2wt, Shp2D61G/wt, and Shp2D61G/D61G embryos in Tg(cd41:GFP, kdrl:mCherry-CAAX) background were isolated. Cells were dissociated and separated by fluorescence-activated cell sorting (FACS), based on cd41:GFPlow expression, prior to single-cell RNA sequencing, as described in the Materials and methods section. (B) Number of cells of distinct genotypes used in single-cell RNA sequencing analysis. (C) Combined t-distributed stochastic neighbor embedding (t-SNE) map generated using the cells of all three genotypes (Shp2wt, Shp2D61G/wt, and Shp2D61G/D61G). Single cells from four major clusters are marked in dark green, blue, pink, and green, and their identities based on marker gene expression are indicated. Minor clusters are marked in gray. (D) Barplots showing the percentage of cells of Shp2wt, Shp2D61G/wt, and Shp2D61G/D61G genotype in distinct clusters. (E) Cells of distinct genotypes Shp2wt, Shp2D61G/wt, and Shp2D61G/D61G are visualized in t-distributed stochastic neighbor embedding (t-SNE) maps in red. (F) t-SNE maps showing log2-transformed read-counts of pu.1. (G) Representative images of the WISH staining for pu.1 expression in 5 dpf Shp2wt and Shp2D61G zebrafish embryos. Scale bar, 100 ?m. (H) Expression of the pu.1 marker scored as low, mid, and high. (I) t-SNE maps showing log2-transformed read-counts of alas-2. (J) Representative images of the WISH staining for alas-2 expression in the tail region of 5 dpf Shp2wt and Shp2D61G zebrafish embryos. Scale bar, 100 ?m. (K) Expression of the alas-2 marker scored as low, mid, and high. (H,K) Number on bars: number of embryos.
|
( |
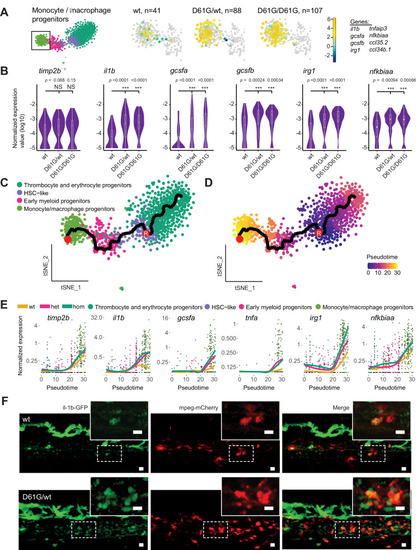
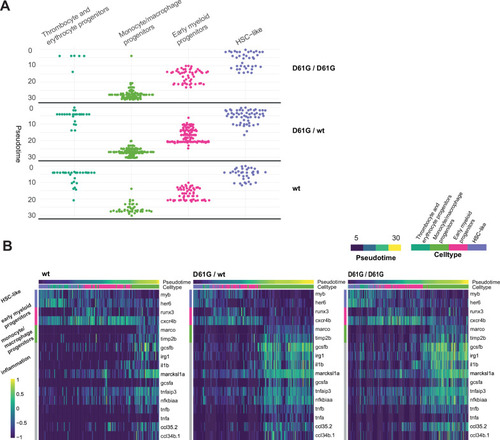
(A) The monocyte/macrophage progenitors cluster (boxed on the t-distributed stochastic neighbor embedding [t-SNE] map on left) was analyzed in detail. log2-transformed sum of read-counts of selected inflammation-related genes from the top 50 differentially expressed genes in the cells of the monocyte/macrophage progenitors cluster, with genotype and number of cells (n) indicated above. (B) Violin plots show the expression of specific genes in monocyte/macrophage progenitors of Shp2wt, Shp2D61G/wt, and Shp2D61G/D61G genotypes. NS, not significant, ***p < 0.001, t-test. (C,D) Monocle pseudotime trajectory of Shp2wt, Shp2D61G/wt, and Shp2D61G/D61G hematopoietic stem and progenitor cells (HSPCs) differentiation superimposed on the four clusters and indicated by color in D. A route leading from hematopoietic stem cell (HSC)-like cells to monocyte/macrophage progenitors was selected and its root (R) and end are marked with red circles. (E) Pseudotemporal expression dynamics of specific genes along the selected route. The lines represent the smoothened regression of the moving average for Shp2wt, Shp2D61G/wt, and Shp2D61G/D61G genotypes. (F) In vivo imaging of the caudal hematopoietic tissue (CHT) region of Shp2wt and Shp2D61G/wt zebrafish embryos in Tg(il1b:eGFP, mpeg:mCherry) background at 5 days post fertilization (dpf). Representative images are shown. The dashed line boxed region of CHT is zoom-in in inset. Scale bar, 10 ?m.
|
( |
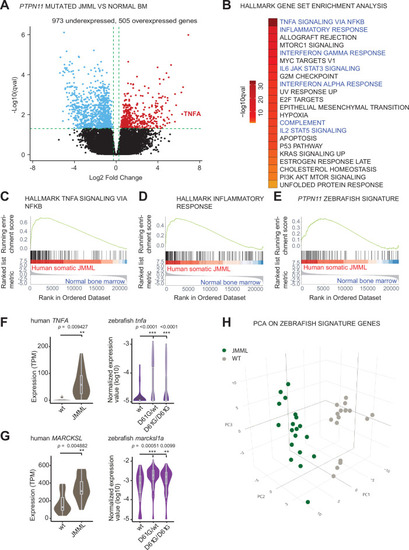
(A) Volcano plot of differentially expressed genes of HSPCs derived from bone marrow of JMML patients with PTPN11 mutations (n = 5) and healthy bone marrow (n = 7). Underexpressed genes are marked in blue and overexpressed genes are marked in red. TNFA expression is highlighted. Green dashed lines indicate the significance level. (B) Gene set enrichment analysis (GSEA) for the MSigDB?s hallmark gene sets in HSPCs from JMML compared to normal human age-matched bone marrow. GSEA plots for TNFA_SIGNALING_VIA_NFKB (C), INFLAMMATORY RESPONSE (D), and the custom zebrafish signature based on the top 100 human orthologous of genes upregulated in monocyte/macrophage progenitor cluster of zebrafish HSPCs (E). Violin plots show the expression of TNFA (F) and MARCKSL (G) in either human wild type (wt) vs. JMML HSPCs, and zebrafish Shp2wt vs. Shp2D61G/wt and Shp2D61G/D61G monocyte/macrophage HSPC progenitors. **p < 0.01, ***p < 0.001, t-test. (H) Principal component analysis (PCA) for the 100 genes included in the custom zebrafish signature. Green dots represent PTPN11 mutated JMML, gray ones represent normal human age-matched bone marrow. PC1: 19% of the variance, PC2: 16% of the variance, PC3: 14% of the variance.
|
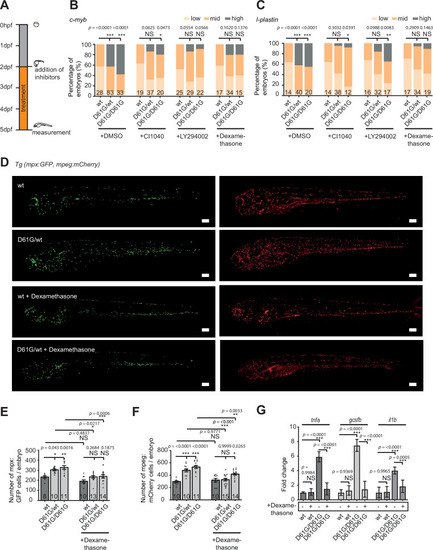
(A) Schematic overview of the treatments with MEK inhibitor CI1040, PI3K inhibitor LY294002, and anti-inflammatory corticosteroid dexamethasone. Embryos were continuously treated from 48 hr post fertilization (hpf) until 5 days post fertilization (dpf), when either whole-mount in situ hybridization (WISH), confocal imaging, or quantitative reverse transcription PCR (RT-qPCR) was performed. (B,C) WISH staining for the expression of the c-myb and l-plastin markers was scored as low, mid, and high. Measurements originate from at least three distinct experiments. Number on bars: number of embryos. NS, not significant; *p < 0.05, **p < 0.01, ***p < 0.001, chi-squared test. (D) Representative images of 5 dpf Shp2wt and Shp2D61G zebrafish embryos in Tg(mpx:GFP, mpeg:mCherry) background without and with dexamethasone treatment. Scale bars, 150 ?m. (E,F) Number of mpx:GFP and mpeg:mCherry-positive cells per embryo. Number on bars: number of embryos. Error bars represent SEM. (G) Expression of tnfa, gcsfb and il1b genes determined by RT-qPCR in Shp2wt and Shp2D61G/D61G zebrafish embryos without and with dexamethasone treatment at 5 dpf, normalized to ef1a expression. Standard deviation of four samples in duplicates for each condition are shown. (E,F,G) *p < 0.05, **p < 0.01, ***p < 0.001. ANOVA complemented by Tukey?s HSD.
|