- Title
-
Partial fads2 Gene Knockout Diverts LC-PUFA Biosynthesis via an Alternative Δ8 Pathway with an Impact on the Reproduction of Female Zebrafish (Danio rerio)
- Authors
- Bláhová, Z., Fran?k, R., Let, M., Bláha, M., P?eni?ka, M., Mráz, J.
- Source
- Full text @ Genes (Basel)
|
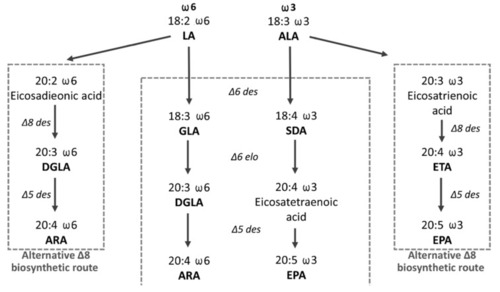
Figure 1. The scheme of the LC-PUFA endogenous biosynthesis of the ?6 and ?3 series from dietary C18:2 ?9,12 (linoleic acid, LA) and C18:3 ?9,12,15 (ALA) fatty acids. Dihomo ?-linolenic acid (DGLA): arachidonic acid (ARA): ?-linoleic acid (GLA): stearidonic acid (SDA): eicosapentaenoic acid (EPA): eicosatrienoic acid (ETA).
|
|
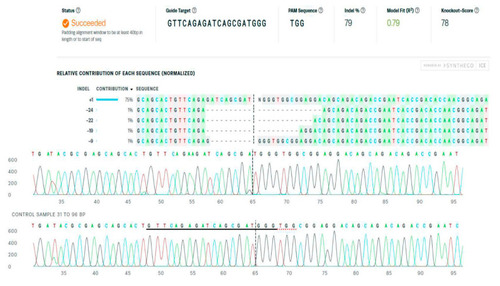
Figure 2. The best hit of single guide RNA for targeting the ATG start codon of the fads2 zebrafish gene (green box by Synthego).
|
|
Figure 3. The Inference of CRISPR Edits (ICE) software output of the analyses of the Sanger sequencing data on the fads2 gene part flanking the mutated ATG start codon in fish representative (here, crispant female No. 1) (ice.synthego.com, accessed on 1 April 2022).
|
|
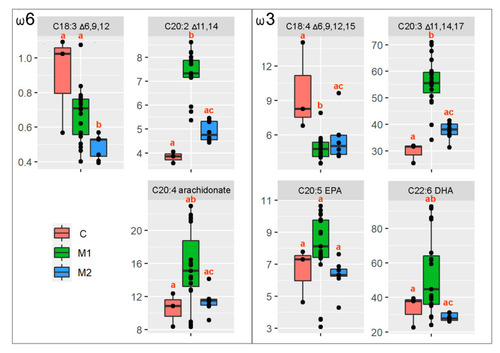
Figure 4. Box and whisker plots for the given LC-PUFA ratio summarizing the median value (black solid horizontal line), first and third quartiles, and minimum and maximum values. The different letters above particular box and whisker plots represent the significant statistical difference among the particular groups.
PHENOTYPE:
|
|
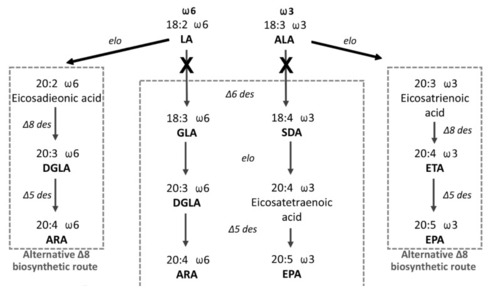
Figure 5. Scheme of the diversion of the LC-PUFA biosynthetic initial step of conversion of LA and ALA from the ?6 pathway, rather than the ?8 pathway in fads2 partial zebrafish mutants.
|
|
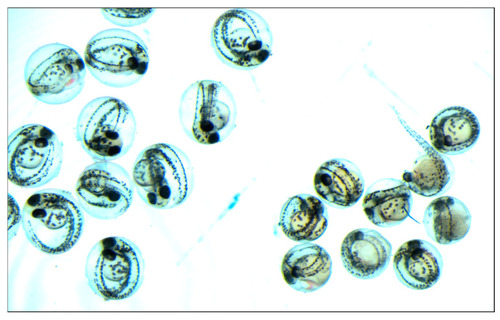
Figure 6. Embryonic lethality and affected development in embryos from crispant female x WT male inter-crosses (right side of the picture) and WT x WT (left side of the picture).
PHENOTYPE:
|

