FIGURE SUMMARY
Title

Loss of the Bardet-Biedl protein Bbs1 alters photoreceptor outer segment protein and lipid composition

Authors
Masek, M., Etard, C., Hofmann, C., Hülsmeier, A.J., Zang, J., Takamiya, M., Gesemann, M., Neuhauss, S.C.F., Hornemann, T., Strähle, U., Bachmann-Gagescu, R.
Source
Full text @ Nat. Commun.

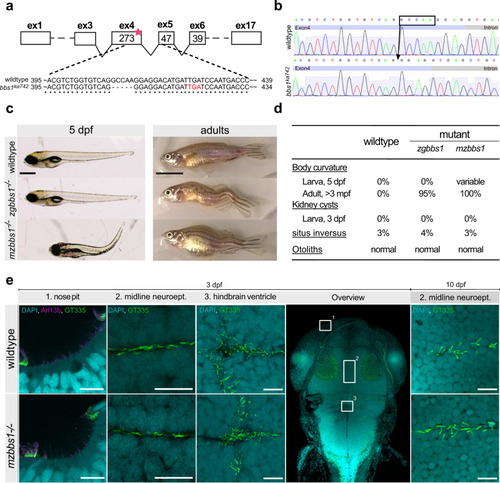
Characterization of <italic>bbs1</italic> mutant zebrafish.

a Deletion of 5 bp in exon 4 of bbs1 causes a frameshift resulting in a premature termination (red letters) (cDNA). b Sanger sequencing of the gDNA flanking the indel highlighting the exon (bright blue box) and the intron (grey box). c Lateral view of 5 dpf larvae and adults (>3 months post fertilization (mpf) with wildtype in the top panel, zygotic mutant (zgbbs1) in the middle panel and maternal zygotic mutant (mzbbs1) in the bottom panel. Of note, presence and degree of body curvature varied in mz mutants (>100 clutches collected). d Summary of the phenotypic characterization with respect to typical cilia-associated phenotypes showing differences between zygotic and maternal zygotic mutants for larval body curvature. Note that scoliosis is present in nearly all zygotic and in all maternal-zygotic adult mutants. Sample sizes: 5dpf n = 200/genotype, adult: n = 60/genotype, 3 dpf kidney/situs inversus/otoliths: n = 100/category. e Whole mount immunostaining of various ciliated tissues including nose pit, midline neuroepithelium, hindbrain ventricle cilia at 3 days post fertilization (dpf) and midline neuroepithelium at 10 dpf. Nose pit cilia were labelled using anti-Arl13b (magenta) or anti-glutamylated tubulin GT335 (green) antibodies. Midline and hindbrain cilia were stained only using anti-glutamylated tubulin GT335 (green). Note that no differences in abundance or morphology of cilia were observed between mzbbs1 mutants (bottom) and their sibling controls (top). All close-up images are dorsal views with rostral to the left and caudal to the right. The overview image indicates orientation. Scale bars: (c) 0.5 mm (larvae), 1 cm (adult), (e) 10 µm.

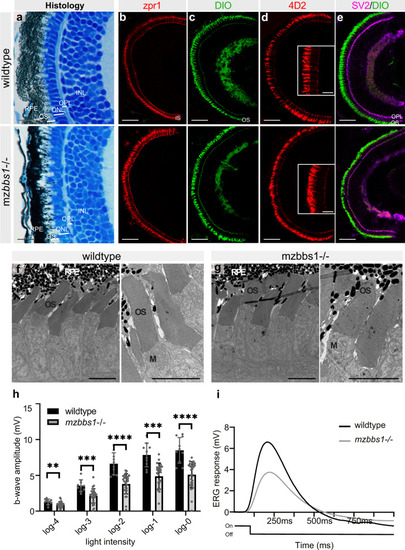
Functional abnormalities in mz<italic>bbs1</italic><sup>−/−</sup> mutants at 5 dpf despite normal eye development and retinal morphology.

(a) Representative images of semi-thin plastic sections stained with Richardson solution in wildtype (top) and maternal zygotic mutants (bottom). Note comparable lamination and layer thickness for OS, ONL, OPL and INL. be Immunostaining on cryosections with zpr1 marking red/green cones (b), DiO labelling membranes (c), 4D2 recognizing opsins in rods and some cones (d) and SV2 overlay with DiO to identify the OPL (e), indicates normal differentiation of retinal cellular subtypes and unaffected organization of the retinal layers in mutants. Staining with 4D2 (d) does not show opsin mislocalization (Insert: magnification of central area). f, g Transmission electron microscopy shows the normal retinal organization and photoreceptor ultrastructure with neat stacking of membrane discs in mzbbs1−/− mutants (right image), similar to their sibling controls (left image). h Bar plots of the maximum b-wave amplitude by electroretinography (ERG) shows a significantly decreased response to light in mzbbs1−/− mutants for all light intensities (log0 to log-4). Unpaired two-tailed multiple T test; Sig: **FDR(q value) < 0.01; ***FDR(q value) < 0.001, ****FDR(q value) < 0.0001; Sample size (n = 10 WT, n = 28 Mut larvae); Error bars show standard deviation around the mean. For more detailed statistics, please see Supplementary Data 6. i Average ERG response curve after a 100 ms light flash at log-2 intensity (Light On/Off line below the ERG curve) for mutant and wildtype. Scale Bars: (a) 10 µm, (be) 50 µm (insert: 10 µm), (f, g) 5 µm, Abbreviations: RPE retinal pigment epithelium, OS outer segment, ONL outer nuclear layer, OPL outer plexiform layer, INL inner nuclear layer, M mitochondria.

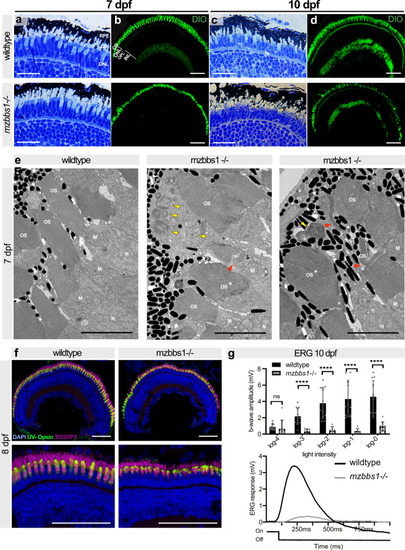
Morphological abnormalities and progressive retinal degeneration in mz<italic>bbs1</italic><sup>−/−</sup> mutants starting at 7 dpf.

a, c Representative images of semi-thin plastic sections stained with Richardson solution in wildtype (top) and mzbbs1−/− (bottom) retina at 7 dpf (a) and 10 dpf (c) showing slight morphological abnormalities at 7 dpf and more severe changes at 10 dpf with shorter and misshapen OSs. b, d DiO-staining highlighting OSs reveals progressive morphological alterations of the OSs between 7 dpf (b) and 10 dpf (d). e TEM reveals bulky OSs (*asterisk) with abnormal membrane disc stacking in mutant retina at 7 dpf. Disc membranes in mutants (middle & right image) are less compact in places or stacked vertically compared to controls (red arrowheads). Membrane-filled swirls are frequently observed in the RPE (yellow arrows) at that stage (middle & right image are two images of mzbbs1−/− retinae showing various alterations seen in the mutants). f At 8dpf, UV-Opsin (green) localizes normally to the OS in mzbbs1−/− mutants and controls, despite abnormal ultrastructure and shortened OS revealed by the membrane dye BODIPY (magenta). g Top panel shows bar plots of the maximum b-wave amplitude by electroretinography at 10 dpf. Reduced b-wave intensity at various light intensities demonstrates severely decreased response to light. Unpaired two-tailed multiple T-test; Sig: ns = FDR(q value) = 0.089, **** = FDR(q value) < 0.0001; Sample size (n = 13 WT, n = 8 Mut larvae), Error bars show standard deviation around the mean. The bottom panel shows the average response curve after a 100 ms light flash at log-2 intensity (Light On/Off line below the ERG curve) for mutant (grey) compared to control (black). Scale Bars: (a,c) 12 µm, (b, d, f) 50 µm, (e) 5 µm. Abbreviations: OS outer segment, ERG electroretinography, INL inner nuclear layer, M mitochondria, N nucleus, ONL outer nuclear layer, OPL outer plexiform layer, P pigment, TEM transmission electron microscopy.

The retinal transcriptome is not primarily affected in <italic>bbs1</italic> mutants.

Eye-specific transcriptomic analysis in 5 dpf and 10 dpf maternal zygotic bbs1−/− larvae and their sibling controls. a Bar plot of the normalized read counts of all BBSome components at 10 dpf shows a significant reduction in bbs1 mRNA, indicating mutation-induced mRNA decay. No significant alteration in mRNA levels of other BBSome components was observed, indicating that no transcriptional compensation effect occurs. Benjamini-Hochberg (BH) adjusted P values of Wald test; Sig: ** = adj. P value = 0.006.; Sample size (n = 3 samples for each condition, composed of a pool of >10 larvae); Error bars show standard deviation around the mean. b Principle component analysis of the Deseq2 normalized, variance-stabilizing transformed top 100 variable genes, shows large variability between sample pairs (batches) at 5 dpf and to a lesser extent at 10 dpf. cd DE genes are visualized in volcano plots by their fold change (FC) (mutant over control) and their adjusted P value. To account for batch effects shown in (b), a paired sample design was considered in the differential expression (DE) analysis following the two-sided Wald test. In red are genes with an adjusted P < 0.05 and fold change >FC ± 2; in blue are genes with adj .P < 0.05 & FC between +2 and −2 and in green are genes with a FC > ± 2 but an adj. P > 0.05. c DE-analysis at 5 dpf reveals only two genes that are significantly changed; neither are associated to a known developmental or BBSome compensation pathway. d At 10 dpf several genes are significantly DE (red dots). e Over-representation analysis was used to group the genes that were DE at 10 dpf into functional groups using Webgestalt KEGG-pathway analysis. Several KEGG pathway terms associated with metabolic change and necroptosis were overrepresented in our data set. Abbreviations: CTRL control, MUT mutant, DE differential expression, FC fold change (mzbbs1−/− over control).

EXPRESSION / LABELING:
Genes:
Fish:
Anatomical Term:
Stage: Days 7-13
PHENOTYPE:
Fish:
Observed In:
Stage: Days 7-13

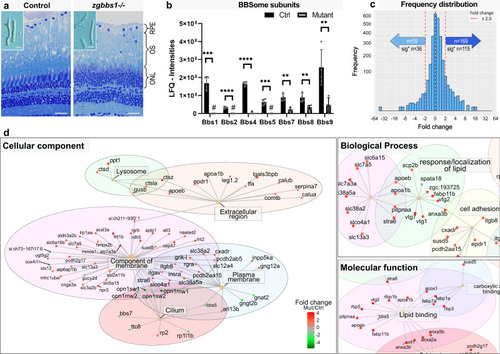
Accumulation of membrane-associated proteins in zg<italic>bbs1</italic><sup>−/−</sup> adult mutant OS.

Quantitative label-free proteomics was applied to mechanically isolated OSs of 5 month old zygotic mutants and sibling controls. a Semi-thin plastic sections stained with Richardson′s solution show persistent OSs with morphological abnormalities in zgbbs1−/− mutants (right image) at 5 month compared to controls (left image). The blow-up images show examples of isolated OSs used for proteomic analysis. b Bar plot showing the sum of normalized peptide LFQ-intensities reported by MaxQuant of all detected BBSome components. Note significant reduction or complete absence (#) of the indicated BBSome components. Independent multiple two-sided T test on LFQ-intensities; Sig:**FDR(q value) < 0.01; Sig: ***FDR(q value) < 0.001; Sig: ****FDR(q value) < 0.0001; sample size (n = 4 Mut and n = 4 Ctrl Samples, each sample is a pool of 7 retinae from 4 animals) exact P values can be found in Supplementary Data 6; Error bars show standard deviation around the mean. c Linear mixed effect models are used to estimate fold changes and P values, which are adjusted for multiple testing by the Benjamini-Hochberg procedure. Binned frequency distribution plot of proteins based on their fold changes (zgbbs1−/− over control) revealing an overall accumulation of proteins (FC > ± 2). Out of the 169 enriched proteins, the abundance of 115 proteins was significantly increased (adj. P < 0.05) while 36 out of the 59 reduced proteins were significantly decreased. d GO-ORA analysis of all proteins (FC > ± 2 & adj. P < 0.05) reveals an overrepresentation of “membrane-associated proteins” for the cellular component term. The majority of these proteins have a positive FC and are enriched in the mutant OSs. In the biological process and molecular function terms, we found an overrepresentation of proteins associated with lipid homeostasis that accumulate in mutant OSs. Complete plots are found in Supplementary Fig. 12. Scale bars: (a) 25 µm, zoom: 10 µm. Abbreviations: RPE retinal pigment epithelium, OS outer segment, ONL outer nuclear layer, GO-ORA Gene ontology over representation analysis, LFQ label-free quantification.

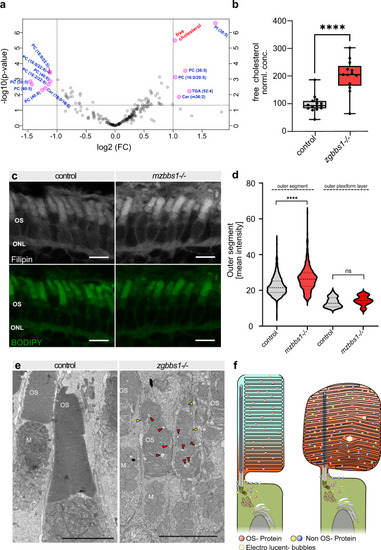
Loss of the BBSome affects the lipid composition of photoreceptor outer segments.

a Volcano plot showing lipids that are significantly affected (P < 0.05 & FC > ± 2) in bbs1 mutant OSs, as identified by targeted lipidomics on isolated OSs of 5 month-old zgbb1−/− fish. MetaboAnalyst provides fold change analysis and P values following two-sided t test statistics. b Box & whisker plot highlighting the roughly twofold enrichment of free cholesterol seen in (a). Independent t test Benjamini- Hochberg corrected Significance: ****P = 3.18e-06; Error bars show the min/max values, boxes show the 25th to 75th percentile around the median. Each data point represents an individual fish (n = 15 Ctrl n = 13 Mut). c Accumulation of free cholesterol in 5 dpf mzbbs1−/− mutants (right image) is verified by staining with the free cholesterol fluorescent reporter Filipin-III (grey), co-stained with the membrane binding dye BODIPY (green). d Violin plot of the mean Filipin fluorescence intensity of single OSs (segmented in the BODIPY channel) shows that free cholesterol significantly accumulates in mutant OS compared to controls but not in the outer plexiform layer at 5 dpf. Mann–Whitney-Test on mean OS intensities: Sig: ****P < 0.0001; (n = 525 Mut OSs, n = 733 Ctrl OSs); Mann–Whitney-Test on mean OPL intensities: Sig: ns = P value 0.1844; (n = 38 Mut images, n = 49 Ctrl images). e TEM images of 5 month old zygotic mutants (right image) reveals dysmorphic OSs with loss of compact membrane stacking, vertical membrane discs (yellow arrowheads) and presence of electro-lucent spherical “bubbles” in the OS (red arrowheads). f Schematic summary of findings in this work, illustrating the altered protein and lipid content caused by Bbs1 loss. In the physiological situation (left image) the OSs have a tightly regulated protein and lipid composition, including a non-homogenous lipid distribution (blue-red gradient). In the bbs1−/− mutant OS (right image) accumulation of non-OS proteins is observed with altered lipid composition, including early accumulation of cholesterol. Morphological anomalies include abnormal OS membrane disc stacking resulting in bulky OSs and electro-lucent spherical “bubbles”. Scale Bars: (c) 5 µm; (e) 5 µm. Abbreviations: TEM transmission electron microscopy, M mitochondria, N nucleus, P pigment, OS outer segment, OPL outer plexiform layer.

Acknowledgments
This image is the copyrighted work of the attributed author or publisher, and ZFIN has permission only to display this image to its users. Additional permissions should be obtained from the applicable author or publisher of the image. Full text @ Nat. Commun.