- Title
-
Deciphering DSC2 arrhythmogenic cardiomyopathy electrical instability: From ion channels to ECG and tailored drug therapy
- Authors
- Moreau, A., Reisqs, J.B., Delanoe-Ayari, H., Pierre, M., Janin, A., Deliniere, A., Bessière, F., Meli, A.C., Charrabi, A., Lafont, E., Valla, C., Bauer, D., Morel, E., Gache, V., Millat, G., Nissan, X., Faucherre, A., Jopling, C., Richard, S., Mejat, A., Chevalier, P.
- Source
- Full text @ Clin Transl Med

ZFIN is incorporating published figure images and captions as part of an ongoing project. Figures from some publications have not yet been curated, or are not available for display because of copyright restrictions. PHENOTYPE:
|

ZFIN is incorporating published figure images and captions as part of an ongoing project. Figures from some publications have not yet been curated, or are not available for display because of copyright restrictions. PHENOTYPE:
|
|
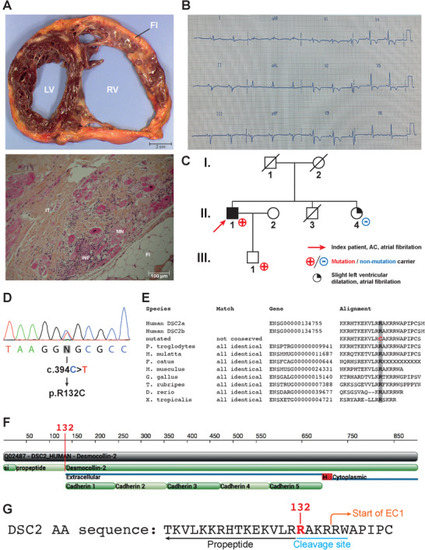
Clinical presentation. (A) Upper panel: transverse section of the ACM patient's explanted heart. The right ventricle (RV) is dilated. Adipo–fibrotic replacement of the myocardium is also observed. Lower panel: Microscopic section of the patient's explanted heart stained with hematoxylin, eosin and safran. Inflammation, adipose tissue and myocardial necrosis are observed. IT, interstitial tissue; INF, inflammation; FI, adipose tissue; MN, myocardial necrosis. (B) Twelve‐lead surface ECG illustrating the patient's electrical profile. The patient was in sinus rhythm with a PR interval at 160 ms, QRS interval at 120 ms and S wave slurring. Negative T waves were observed in V2 through V5. (C) Family pedigree. The index patient (II.1) is indicated by a red arrow. Individuals indicated with a red cross carry the mutation (II‐1 and III‐1). (D) Electropherogram of the patient's DNA showing the |
|
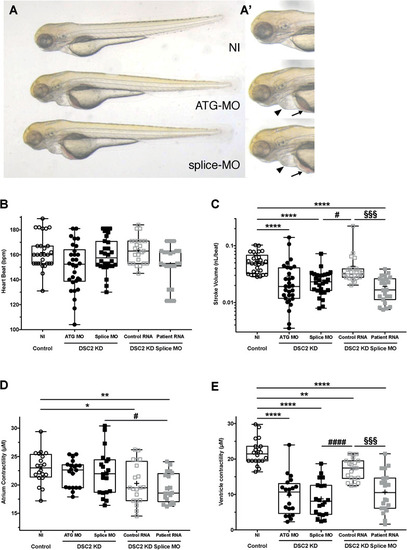
In vivo effect of DSC2 knockdown and mutation. (A) Bright‐field images of noninjected (NI), PHENOTYPE:
|
|
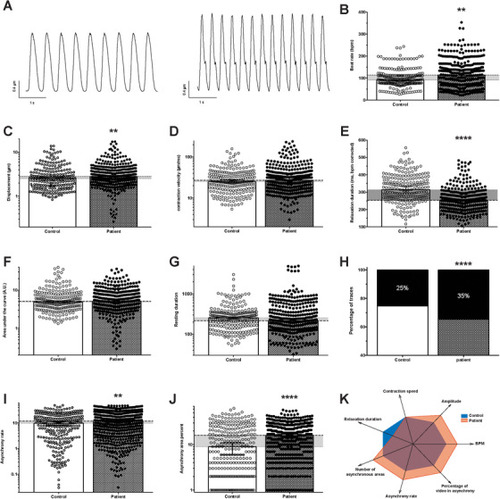
Evaluation of control and patient‐specific hiPSC‐CM spontaneous contractile function by video microscopy. (A) Contraction cycles from phase‐contrast videos of control (left) and patient‐specific (right) hiPSC‐CM monolayers obtained using custom made software analysis. (B–J) Contraction characteristics of control ( |
|
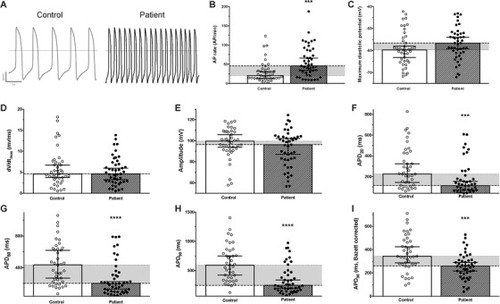
Spontaneous electrical activity of control and patient‐specific hiPSC‐CM. (A) Raw traces illustrating the recording of spontaneous electrical activity (action potentials, AP) of control (left) and patient‐specific (right) hiPSC‐CM. (B |
|
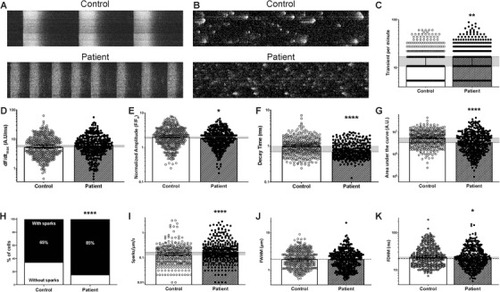
Spontaneous calcium dynamics of control and patient‐specific hiPSC‐CM. (A) Typical line‐scan confocal images (5000 lines, 1.24 ms/line, 1 × 512 pixels) of calcium transients in Fluo‐4 non‐ratiometric fluorescent probe‐loaded control (top) and patient‐specific (bottom) hiPSC‐CM. (B) The global transient activity was removed from the original image to keep only diastolic Ca2+ activity (sparks). (C–K). Both the Ca2+ transient activity (control |
|
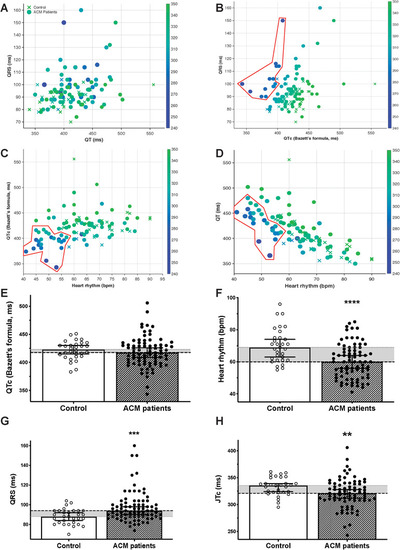
ECG parameters of an ACM cohort. ECG parameters and interdependence in a cohort of control ( |

