FIGURE SUMMARY
Title

NCK-associated protein 1 like (nckap1l) minor splice variant regulates intrahepatic biliary network morphogenesis

Authors
Ghaffari, K., Pierce, L.X., Roufaeil, M., Gibson, I., Tae, K., Sahoo, S., Cantrell, J.R., Andersson, O., Lau, J., Sakaguchi, T.F.
Source
Full text @ PLoS Genet.

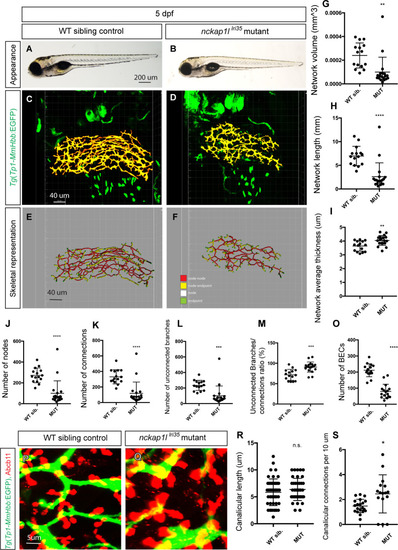
<italic>nckap1l</italic><sup><italic>lri35</italic></sup> mutant larvae show specific defects in the intrahepatic biliary network.

(A and B) Representative physical appearance of wild-type (WT) sibling (A) and nckap1llri35 mutant (B) larvae at 5 days post-fertilization (dpf). Lateral views. At 5 dpf, there is no significant difference in physical appearance in nckap1llri35 mutant larvae, although their swim bladder inflation is occasionally delayed. (C and D) Projected confocal images of Tg(Tp1-MmHbb:EGFP)um14 expression in WT (C) and nckap1llri35 mutant (D) larvae at 5 dpf. GFP expression in the intrahepatic biliary network is shown in pseudocolored yellow. Ventral views, anterior to the top. (E and F) Skeletal representation of the intrahepatic biliary network in WT (E) and nckap1llri35 mutant (F) larvae computed based on Tg(Tp1-MmHbb:EGFP)um14 expression at 5 dpf. The complex three-dimensional network is represented by a combination of four segments: end points (colored green), nodes (colored white), node-node connections (colored red), and node-end point connections (colored yellow). (G-M) Computational skeletal analysis-based measurements of the intrahepatic biliary network structures of WT and nckap1llri35 mutant larvae at 5 dpf. (G) The total network volume of the intrahepatic biliary network marked by Tg(Tp1-MmHbb:EGFP)um14 expression in the liver. (H) The total network length of the intrahepatic biliary network. (I) The average thickness of the intrahepatic biliary network. (J) The total number of nodes existing in the intrahepatic biliary network. (K) The total number of node-to-node connections. (L) The total number of unconnected branches (node-to-end point connections). (M) The ratio of connected to unconnected branches shown as a percentage. Each dot represents the measurement data from one larva. n = 13 for WT siblings and n = 17 for mutant larvae. Error bars are standard deviation. *P<0.05, **P<0.01. n.s., not significant. (N and O) Projected images of confocal z-stacks of the liver in WT (N) or nckap1llri35 mutant (O) larvae visualized for expression of the bile canaliculi marker Abcb11 (Red) and the intrahepatic biliary network marker Tg(Tp1-MmHbb:EGFP)um14 (Green) at 5 dpf. (P) Average length of canaliculus measured based on Abcb11 expression. A total of 90 canaliculi were analyzed. (Q) The number of canaliculi connected per 10 μm of the intrahepatic biliary network (n = 50 for WT and n = 40 for nckap1llri35 mutant). Error bars are standard deviation. *P<0.05. n.s., not significant.

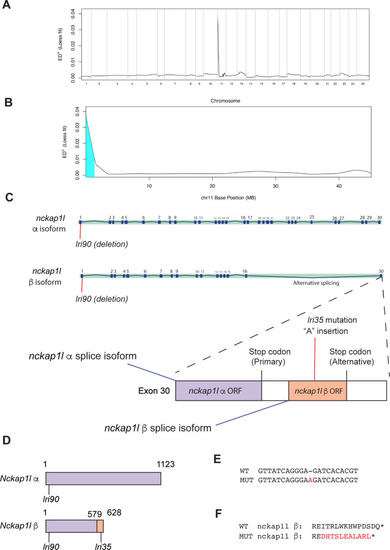
The <italic>lri35</italic> mutation disrupts the minor isoform of the <italic>nckap1l</italic> gene.

(A) Mapping of the lri35 mutation. Whole genome-wide Loess fit curve for SNP allele frequency Euclidean distance computed by the MMAPPR algorithm. Chromosome 11 showed the highest score. (B) Loess fit curve for SNP allele frequency Euclidean distance within chromosome 11. The critical region was mapped to the distal tip of chromosome 11. (C) The nckap1l gene has two splice isoforms: the previously annotated major splice isoform (α isoform) and an unknown minor isoform (ß isoform). The lri35 mutation, which is a one-nucleotide insertion, is located in the last exon and induces a frameshift only in the ß isoform of the nckap1l gene. These data indicate that the minor isoform of the nckap1l gene is responsible for the phenotypes in lri35 mutant larvae. (D) Schematic of Nckap1l α and ß proteins. The entire Nckap1l α protein is recognized as the Nckap1l domain (purple box). Due to the alternative splicing of the nckap1l gene, Nckap1l ß shifted to the ß specific sequence (orange box) after the position 579. The lri90 mutation affects both Nckap1l α and ß, whereas the lri35 mutation affects Nckap1l ß only. (E) The lri35 mutation is an insertion mutation that inserts an additional adenine nucleotide into the nckap1l gene. (F) The lri35 mutation induces a frameshift and changes the last 13 amino acids of the ß isoform of the Nckap1l protein.

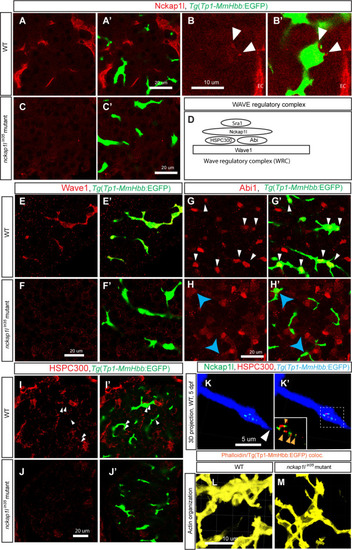
Expression of Nckap1l and other WRC proteins in the liver of wild-type and <italic>nckap1l</italic><sup><italic>lri35</italic></sup> mutant larvae.

(A-C) Z-plane confocal images of the liver visualized for Nckap1l (Red) expression in wild-type (WT) (A and B) and nckap1llri35 mutant (C) larvae at 5 dpf. Overlay images with biliary epithelial cell marker Tg(Tp1-MmHbb:EGFP)um14 (Green) shown separately in (A’-C’). Nckap1l is predominantly expressed in endothelial cells in the liver (A), but higher magnification z-plane image (B) shows that Nckap1l is also localized in biliary epithelial cells (white arrowheads). Nckap1l expression is missing in the liver of nckap1llri35 mutant larvae (C). Ventral views, anterior to the top. EC, endothelial cells. (D-H) Components of the WAVE regulatory complex are degraded in biliary epithelial cells of nckap1llri35 mutant larvae. (D) Schematic drawing of the WAVE regulatory complex (WRC). This complex acts downstream of Cdk5 and activated Rac1 to stimulate actin remodeling through the actin regulatory complex. The WAVE regulatory complex is a pentameric heterocomplex that consists of WAVE (1, 2 or 3), Abi (1 or 2), Sra1, Nckap1l (or Nap1), and HSPC300. (E and F) Z-plane confocal images of the liver visualized for WAVE1 expression (Red) in WT (E) and nckap1llri35 mutant (F) larvae at 5 dpf. Overlay images with biliary epithelial cell marker Tg(Tp1-MmHbb:EGFP)um14 are shown separately in (E’ and F’). WAVE1 is expressed predominantly in biliary epithelial cells in WT larvae; however, in nckap1llri35 mutant larvae, WAVE1 expression disappears from biliary epithelial cells, suggesting that WAVE1 undergoes degradation in biliary epithelial cells. (G and H) Z-plane confocal images of the liver visualized for Abi1 expression in WT (G) and nckap1llri35 mutant (H) larvae at 5 dpf. Overlay images with biliary epithelial cell marker Tg(Tp1-MmHbb:EGFP)um14 are shown separately in (G’ and H’). Abi1 localizes to the nuclei of hepatocytes and biliary epithelial cells (white arrowheads) in the wild-type liver. However, in the liver of nckap1llri35 mutant larvae, Abi1 staining in the nuclei of biliary epithelial cells is lost (yellow arrows), while Abi1 expression remains in hepatocytes, suggesting that Abi1 undergoes degradation specifically in biliary epithelial cells. (I and J) Z-plane confocal images of the liver visualized for HSPC300 expression in WT (I) and nckap1llri35 mutant (J) larvae at 5 dpf. Overlay images with biliary epithelial cell marker Tg(Tp1-MmHbb:EGFP)um14 are shown separately in (I’ and J’). Similar to Nckap1l, HSPC300 is predominantly expressed in endothelial cells in the liver, but HSPC300 is also expressed in biliary epithelial cells (White arrowheads in I). HSPC300 expression is missing in the liver of nckap1llri35 mutant larvae (J). (K) Projected confocal image of co-localizing signal between Nckap1l and Tg(Tp1-MmHbb:EGFP)um14 showing Nckap1l expression (pseudocolored green) in biliary epithelial cells at 5 dpf. Tg(Tp1-MmHbb:EGFP)um14 expression is shown in pseudocolored blue. Nckap1l is localized near the projection tip (white arrowhead), but not exactly at the tip. Colocalizing signal between HSPC300 and Tg(Tp1-MmHbb:EGFP)um14 showing HSPC300 expression (red) in biliary epithelial cells is overlaid in (K’). This indicates that HSPC300 is expressed in biliary epithelial cells. Nckap1l and HSPC300 colocalize in biliary epithelial cells (orange arrowheads) near the projection tips of biliary epithelial cells, suggesting that the WRC forms at this site. Boxed area is magnified and shown separately in the left bottom corner. A representing image of total 21 projection tips from 5 different wild-type larvae examined is shown. Ventral views, anterior to the top. (L and M) Projected co-localizing signal images computed based on Tg(Tp1-MmHbb:EGFP)um14 and phalloidin expressions visualizing the actin network in biliary epithelial cells in wild-type (I) and nckap1llri35 mutant (J) larvae at 5 dpf. Confocal images are representative of at least three independent experiments.

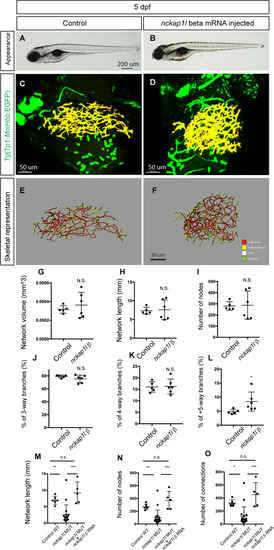
<italic>nckap1l</italic> ß overexpression induced biliary system-specific phenotypes.

(A and B) Representative physical appearance of wild-type (WT) control (A) and nckap1l ß mRNA-injected (B) larvae at 5 dpf. Lateral views. At 5 dpf, there is no significant difference in physical appearance in larvae overexpressing nckap1l ß. (C and D) Projected confocal images of Tg(Tp1-MmHbb:EGFP)um14 expression in WT (C) and nckap1l ß RNA-injected (D) larvae at 5 dpf. GFP expression in the intrahepatic biliary network is shown in pseudocolored yellow. (E and F) Skeletal representation of the intrahepatic biliary network in WT (E) and nckap1l ß RNA-injected (F) larvae computed based on Tg(Tp1-MmHbb:EGFP)um14 expression at 5 dpf. The end points (green), nodes (white), node-node connections (red), and node-end point connections (yellow) are colored separately. Ventral views, anterior to the top. (G-L) Computational skeletal analysis-based measurements of the intrahepatic biliary network structures of WT and nckap1l ß RNA-injected larvae at 5 dpf. (G) The total network volume of the intrahepatic biliary network marked by Tg(Tp1-MmHbb:EGFP)um14 expression in the liver. (H) The total network length of the intrahepatic biliary network. (I) The number of nodes in the intrahepatic biliary network. (J) The ratio of 3-way branching nodes per all nodes shown as a percentage. (K) The ratio of 4-way branching nodes per all nodes shown as a percentage. (L) The ratio of 5-or-more-way branching nodes per all nodes shown as a percentage. These data together indicate that nckap1l ß RNA injection induced a phenotype in the intrahepatic biliary network. n = 5 for WT, and n = 6 for nckap1l ß RNA-injected larvae. (M-O) nckap1l ß RNA injection rescued nckap1llri35 mutant phenotypes. Network structural sub-parameters were calculated in uninjected nckap1llri35 mutant, uninjected wild-type, and nckap1l ß RNA-injected nckap1llri35 mutant larvae at 5 dpf. (M) The total network length. (N) The number of nodes. (O) The number of connections. *P<0.05, **P<0.01, and ***P<0.001. n.s., not significant.

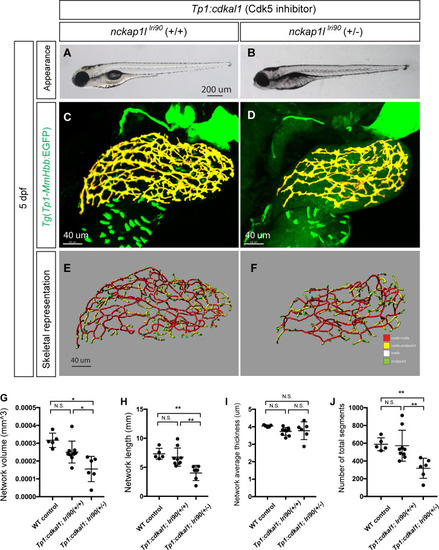
Dosage-sensitive genetic interaction between <italic>nckap1l</italic> and <italic>cdk5</italic> indicates these two genes function as part of the same pathway.

(A and B) Representative physical appearance of Tg(tp1:cdkal1)kl109 larvae (nckap1llri90(+/+);Tg(tp1:cdkal1)kl109) (A), which expresses the Cdk5 inhibitor in biliary epithelial cells, and heterozygous nckap1llri90 larvae expressing Tg(tp1:cdkal1)kl109 (nckap1llri90(+/-);Tg(tp1:cdkal1)kl109) (B) at 5 dpf. At 5 dpf, there is no significant difference in physical appearance in both genotypes. (C and D) Projected confocal images of Tg(Tp1-MmHbb:EGFP)um14 expression in nckap1llri90(+/+);Tg(tp1:cdkal1)kl109 (C) and nckap1llri90(+/-);Tg(tp1:cdkal1)kl109 (D) larvae at 5 dpf. GFP expression in the intrahepatic biliary network is shown in pseudocolored yellow. nckap1llri90(+/-);Tg(tp1:cdkal1)kl109 larvae show more severe intrahepatic biliary network phenotypes than nckap1llri90(+/-);Tg(tp1:cdkal1)kl109 larvae, although heterozygous nckap1llri90 larvae show no observable phenotype without being crossed to Tg(tp1:cdkal1)kl109. (E and F) Skeletal representation of the intrahepatic biliary network in nckap1llri90(+/+);Tg(tp1:cdkal1)kl109 (E) and nckap1llri90(+/-);Tg(tp1:cdkal1)kl109 (F) larvae computed based on Tg(Tp1-MmHbb:EGFP)um14 expression at 5 dpf. The end points (green), nodes (white), node-node connections (red), and node-end point connections (yellow) are colored separately. Ventral views, anterior to the top. (G-J) Computational analysis-based measurements of the intrahepatic biliary network structures of wild-type (WT) control, nckap1llri90(+/+);Tg(tp1:cdkal1)kl109 and nckap1llri90(+/-);Tg(tp1:cdkal1)kl109 larvae at 5 dpf. n = 10 for nckap1llri90(+/+);Tg(tp1:cdkal1)kl109 and n = 7 for nckap1llri90(+/-);Tg(tp1:cdkal1)kl109. (G) The total network volume of the intrahepatic biliary network marked by Tg(Tp1-MmHbb:EGFP)um14 expression in the liver. (H) The total network length of the intrahepatic biliary network. (I) The average thickness of the intrahepatic biliary network. (J) Total segment number of the skeletonized network. These data together indicate that losing one copy of the nckap1l gene significantly enhanced the effect of Cdk5 suppression in biliary epithelial cells, suggesting that nckap1l and cdk5 function in the same signaling pathway. *P<0.05, and **P<0.01. n.s., not significant.

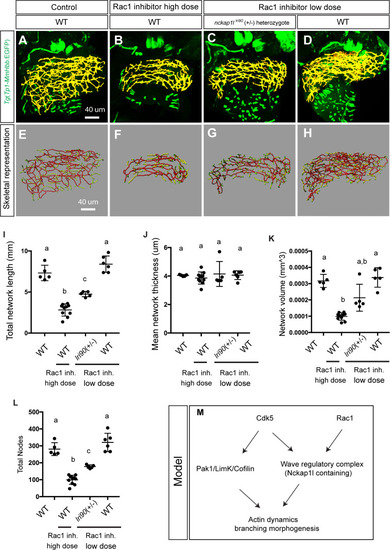
<italic>nckap1l</italic> dosage-dependent sensitization to Rac1 inhibitor treatment suggests that Nckap1l acts downstream of Rac1 to regulate intrahepatic biliary network branching morphogenesis.

Wild-type and heterozygous nckap1llri90 mutant larvae were treated with either high dose (50 ug/ml) or low dose (10 ug/ml) Rac1 inhibitor from 3 to 5 dpf, and then the treated larvae were analyzed at 5 dpf. (A-D) Projected confocal images of Tg(Tp1-MmHbb:EGFP)um14 expression in control wild-type (A), high dose (50 ug/ml) Rac1 inhibitor-treated wild-type (B), low dose (10 ug/ml) Rac1 inhibitor-treated heterozygous nckap1llri90 mutant (C), and low dose (10 ug/ml) Rac1 inhibitor-treated wild-type (D) larvae at 5 dpf. GFP expression in the intrahepatic biliary network is shown in pseudocolored yellow. (E-H) Skeletal representation of the intrahepatic biliary network in wild-type (E), 50 ug/ml Rac1 inhibitor-treated wild-type (F), 10 ug/ml Rac1 inhibitor-treated heterozygous nckap1llri90 mutant (G), and 10 ug/ml Rac1 inhibitor-treated wild-type (H) larvae computed based on Tg(Tp1-MmHbb:EGFP)um14 expression at 5 dpf. The end points (green), nodes (white), node-node connections (red), and node-end point connections (yellow) are colored separately. Ventral views, anterior to the top. (I-L) Computational analysis-based measurements of the intrahepatic biliary network structures of wild-type, high dose (50 ug/ml) Rac1 inhibitor-treated wild-type, low dose (10 ug/ml) Rac1 inhibitor-treated heterozygous nckap1llri90 mutant, and low dose (10 ug/ml) Rac1 inhibitor-treated wild-type larvae at 5 dpf. (I) Total network length of the intrahepatic biliary network. (J) Mean network thickness of the intrahepatic network. (K) Network volume (mm3) of the intrahepatic biliary network. (L) Total number of nodes in the intrahepatic biliary network. These data together indicate that low dose (10 ug/ml) Rac1 inhibitor treatment did not cause any observable phenotype in the intrahepatic biliary network of wild-type larvae, but losing one copy of the nckap1l gene significantly enhanced the effect of low dose (10 ug/ml) Rac1 inhibitor treatment and induced a phenotype to closer to that of high dose (50 ug/ml) Rac1 inhibitor treated wild-type larvae. These data suggest that nckap1l acts downstream of Rac1 to regulate intrahepatic biliary network branching morphogenesis. Plots with a shared letter indicate that the difference is not statistically significant. (M) Model of the Cdk5-mediated kinase cascade that regulates branching morphogenesis of the intrahepatic biliary network. We have previously shown that Cdk5 regulates the Pak1/Limk1/Cofilin kinase cascade to regulate actin dynamics. The current study revealed that Cdk5 also regulates the WAVE regulatory complex to regulate branching morphogenesis of the intrahepatic biliary network. In this process, a previously unannotated minor splice isoform of Nckap1l appears to be important to form a functional WAVE regulatory complex in biliary epithelial cells.

Acknowledgments
This image is the copyrighted work of the attributed author or publisher, and ZFIN has permission only to display this image to its users. Additional permissions should be obtained from the applicable author or publisher of the image. Full text @ PLoS Genet.