FIGURE SUMMARY
Title

Sexually dimorphic roles for the type 2 diabetes-associated C2cd4b gene in murine glucose homeostasis

Authors
Mousavy Gharavy, S.N., Owen, B.M., Millership, S.J., Chabosseau, P., Pizza, G., Martinez-Sanchez, A., Tasoez, E., Georgiadou, E., Hu, M., Fine, N.H.F., Jacobson, D.A., Dickerson, M.T., Idevall-Hagren, O., Montoya, A., Kramer, H., Mehta, Z., Withers, D.J., Ninov, N., Gadue, P.J., Cardenas-Diaz, F.L., Cruciani-Guglielmacci, C., Magnan, C., Ibberson, M., Leclerc, I., Voz, M., Rutter, G.A.
Source
Full text @ Diabetologia

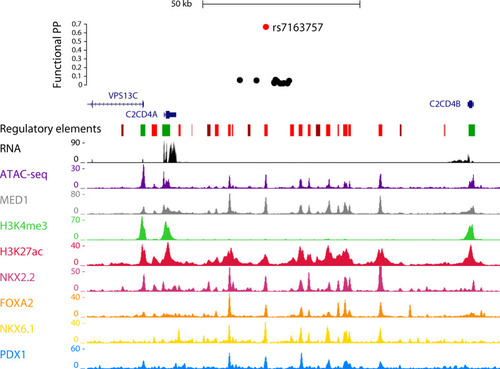
Genomic context of type 2 diabetes variants in the VPS13C/C2CD4A/C2CD4B locus. SNP at rs7163757 is located in an open chromatin region between C2CD4A and C2CD4B, as assessed by Assay for Transposase-Accessible Chromatin sequencing (ATAC-seq) data. Chromatin immunoprecipitation and next generation sequencing (ChIP-seq) data reveals binding sites for transcription factors involved in the development and function of beta cells, including forkhead box protein A2 (FOXA2), NK2 homeobox 2 (NKX2.2), NK6 homeobox 1 (NKX6.1) and pancreatic and duodenal homeobox 1 (PDX1). MED1, mediator complex subunit 1. Functional PP, functional posterior probability. Data from [39]

Characterisation of C2cd4b-null mice. (a) C2cd4b global null mice (C2cd4bem2Wtsi) were generated by the IMPC. Using CRISPR/Cas9, the encoding exon from murine C2cd4b (exon 2) was deleted. (b) C2cd4b+/− (heterozygous) animals were setup as breeding pairs and the WT (C2cd4b+/+) and homozygous (C2cd4b−/−) littermates were studied. (c) RT-qPCR was performed on RNA from isolated islets and showed a significant decrease in C2cd4b mRNA levels in homozygous animals (p=0.0092). C2cd4b+/+n=4, C2cd4b+/−n=3, C2cd4b−/−n=7. **p<0.01, unpaired Student’s t test. (d, e) Changes in weight of C2cd4b+/+ and C2cd4b−/− female (d) and male (e) mice over time on an RC diet or HFD. RC: female (F)+/+n=3–6; F−/−n=4–13; male (M)+/+n=8–12; M−/−n=10–12. HFD: F+/+n=9–12, F−/−n=5–10–12; M+/+n=6–12, M−/−n=7–12. (f, g) Fasting blood glucose level in female (f) and male (g) mice on an HFD were measured at 23 weeks of age. F+/+n=9; F−/−n=5; M+/+n=5; M−/−n=7. (h, i) Percentage of body fat (h) and lean mass (i) in males maintained on an HFD at 20 weeks of age. *p<0.05, **p<0.01, ***p<0.001, mixed-effect analysis, RC-fed WT vs RC-fed mutant mice or HFD-fed WT vs HFD-fed mutant mice at each time point (d, e), or Student’s t test (c, fi). Data were assessed for significance using an unpaired Student’s t test or two-way ANOVA where two genotypes were compared. Values represent means ± SEM

C2cd4b-null mice display glucose intolerance in glucose tolerance tests (IPGTTs/OGTTs). (a, b) IPGTTs were performed on female (a) and male (b) mice maintained on an RC diet, at 22 weeks of age. (c, d) OGTTs were performed on C2cd4b-null and WT female (c) and male (d) mice on an RC, at 20 weeks of age. (e, f) IPGTTs were performed on C2cd4b-null and WT female (e) and male (f) mice maintained on an HFD, at 23 weeks of age. (g, h) OGTTs were performed on C2cd4b female (g) and male (h) mice on an HFD, at 20 weeks of age. AUC analyses are also shown. The n values under bar graphs represent the number of animals used (the same number of samples were used for blood glucose and AUC graphs). *p<0.05, **p<0.01, ***p<0.001 vs mutant animal at same time point or as indicated. Blood glucose curves assessed by two-way ANOVA with Bonferroni’s multiple comparison test; AUC analyses assessed using an unpaired Student’s t test. Values represent means ± SEM

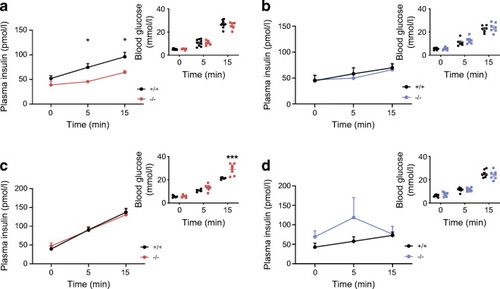
Effect of C2cd4b deletion on in vivo glucose-stimulated insulin secretion. (ad) In vivo insulin levels during IPGTT in C2cd4b-null and WT females (a, c) and males (b, d) on an RC diet, at 23 weeks of age (a, b) or an HFD at 19 weeks of age (c, d). RC: female (F)+/+n=9; F−/−n=6; male (M)+/+n=6; M−/−n=7. HFD: F+/+n=5; F−/−n=7; M+/+n= 7; M−/−n=7. *p<0.05, ***p<0.001, WT vs mutant animal at same time point, two-way ANOVA with Bonferroni’s multiple comparison test. Values represent mean ± SEM

Effect of deletion of C2cd4b on sex hormones and hormone release from the pituitary gland. (a) RT-qPCR on samples from the pituitary glands shows basal level of mRNA expression of C2cd4b in animals deleted for this gene compared with WT mice. (b, c) Measurement of E2 and testosterone levels upon deletion of C2cd4b in female and male mice maintained on either an RC diet or an HFD. (d, e) Circulating LH levels in C2cd4b-null and WT female (d) and male (e) mice after injections with saline (154 mmol/l NaCl; vehicle), E2 or testosterone (animals were maintained on an RC diet). (f, g) Circulating FSH levels in C2cd4b-null and WT female (f) and male (g) mice after injections with saline (vehicle), E2 or testosterone (animals were maintained on an RC diet). Female (F)+/+n=6, F−/−n=5; male (M)+/+n=4; M−/−n=5. **p<0.01, ***p<0.001, unpaired Student’s t test. Values represent mean ± SEM

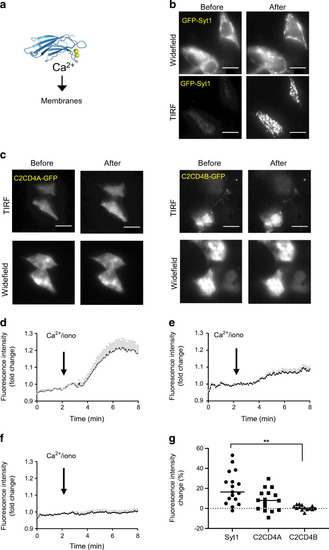
Changes in C2CD4A and C2CD4B localisation in response to increased intracellular [Ca2+]. (a) Schematic showing the principle of Ca2+-dependent translocation of C2 domains to the plasma membrane. The ribbon diagram reproduced from [57] under the terms of the Creative Commons Attribution 4.0 International License (http://creativecommons.org/licenses/by/4.0/), which permits unrestricted use, distribution, and reproduction in any medium. (b) Localisation of GFP-Syt1 in cells incubated in KREBH buffer with 3 mmol/l glucose, shown before and after an increase in intracellular Ca2+ levels (achieved by addition of 50 ng/ml ionomycin), obtained by simultaneous wide-field and TIRF image acquisition (positive control). (c) Localisation of GFP-tagged C2CD4A and -C2CD4B before and after addition of ionomycin, obtained by simultaneous wide-field and TIRF image acquisition. (d, f) Time courses for the translocation of the GFP-tagged proteins, Syt1 (d), C2CD4A (e) or C2CD4B (f) obtained by TIRF imaging before and after addition of ionomycin (iono). (df) Solid black lines represent mean; SEM shown by grey bars. (g) Assessment of fluorescence intensity change (%) reveals an increase in C2CD4A intensity at the plasma membrane after the imposed increase in intracellular Ca2+ levels, which was similar to that observed for Syt1 protein translocation, whilst C2CD4B translocation was significantly lower than Syt1. For each condition, n=3 independent experiments were performed; n=44 cells were tracked in Syt1, n=29 cells were tracked in the case of C2CD4A, and n=30 cells were tracked in the case of C2CD4B. Scale bars = 10 μm. **p<0.01, one-way ANOVA

ZFIN is incorporating published figure images and captions as part of an ongoing project. Figures from some publications have not yet been curated, or are not available for display because of copyright restrictions.

ZFIN is incorporating published figure images and captions as part of an ongoing project. Figures from some publications have not yet been curated, or are not available for display because of copyright restrictions.

Acknowledgments
This image is the copyrighted work of the attributed author or publisher, and ZFIN has permission only to display this image to its users. Additional permissions should be obtained from the applicable author or publisher of the image. Full text @ Diabetologia