FIGURE SUMMARY
Title

Diverse species-specific phenotypic consequences of loss of function sorting nexin 14 mutations

Authors
Bryant, D., Seda, M., Peskett, E., Maurer, C., Pomeranz, G., Ghosh, M., Hawkins, T.A., Cleak, J., Datta, S., Hariri, H., Eckert, K.M., Jafree, D.J., Walsh, C., Demetriou, C., Ishida, M., Alemán-Charlet, C., Vestito, L., Seselgyte, R., McDonald, J.G., Bitner-Glindzicz, M., Hemberger, M., Rihel, J., Teboul, L., Henne, W.M., Jenkins, D., Moore, G.E., Stanier, P.
Source
Full text @ Sci. Rep.

ZFIN is incorporating published figure images and captions as part of an ongoing project. Figures from some publications have not yet been curated, or are not available for display because of copyright restrictions.

PHENOTYPE:
Fish:
Observed In:
Stage: Day 4

ZFIN is incorporating published figure images and captions as part of an ongoing project. Figures from some publications have not yet been curated, or are not available for display because of copyright restrictions.

PHENOTYPE:
Fish:
Observed In:
Stage: Day 4

ZFIN is incorporating published figure images and captions as part of an ongoing project. Figures from some publications have not yet been curated, or are not available for display because of copyright restrictions.

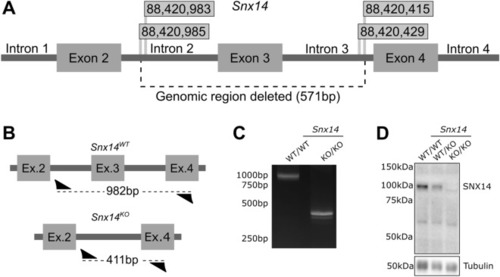
Generation of Snx14 mutant mice. (A) The C57BL/6J mouse Snx14 gene was targeted with sgRNA guided CRISPR/Cas9 to cut specific sites. Flags display the position of these sites (Chromosome 9) either side of exon 3. The selected mutant had a 571-nucleotide deletion encompassing exon 3 of the Snx14 gene, resulting in a frame shift K114fs + 5*. (B) Primers (arrow heads) flanking this deletion were used to examine the mutation yielding bands of 982 bp from the Snx14WT/WT allele and 411 bp in from the Snx14KO allele. (C) PCR products generated from the primers flanking the deleted region. (D) Western blot showing loss of SNX14 protein in Snx14KO/KO mice. Original gels and blots are presented in Supplemental Fig. S2.

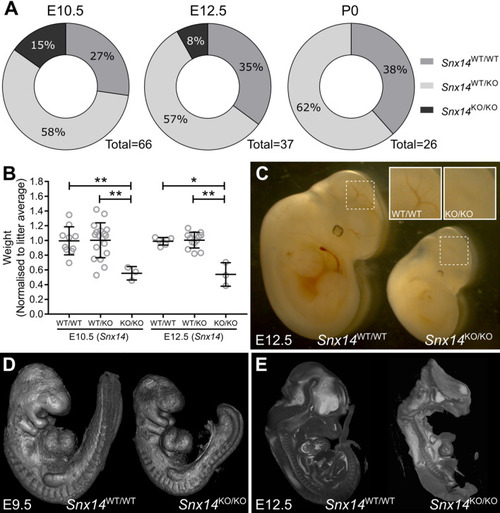
Homozygous Snx14 mutation causes embryonic lethality in mice. (A) Viable Snx14KO/KO embryos are not detected at Mendelian ratios at E10.5 and no Snx14KO/KO mice were found at P0. (B) Snx14KO/KO weighed less than their Snx14WT/WT and Snx14WT/KO littermates. Bars = Mean ± SD, *p < 0.05, **p < 0.01, one-way ANOVA. (C) Snx14KO/KO embryos appear smaller, without clear vascularisation in the head (insets). (D) Surface visualisation of Snx14WT/WT and Snx14KO/KO embryos with optical projection tomography. (E) Internal visualisation of Snx14WT/WT and Snx14KO/KO embryos with high resolution episcopic microscopy (HREM).

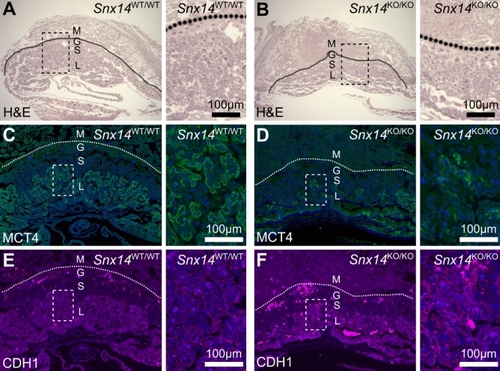
Homozygous Snx14 mutation causes placental abnormalities in mice. (A, B) Placentas from E10.5 mice were examined with hematoxylin and eosin (H&E) stain to examine tissue structure. (C, D) Monocarboxylate transporter 4 (MCT4, green) is expressed in syncitiotrophoblasts of the labyrinthine zone. (E, F) E-Cadherin (CDH1, magenta). (CF) Sections were counterstained with DAPI (Blue). Maternal decidua (M), giant cells (G), spongiotrophoblasts (S) and labyrinth (L).

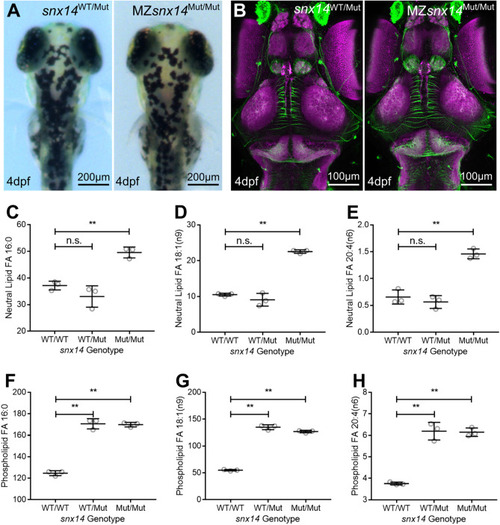
Constitutive homozygous snx14 mutations do not impact zebrafish morphology at 4dpf but do increase FAs from neutral lipid and phospholipids. (A) Illustration and demonstration of zebrafish eye (E) width and head (H) width measurements of maternal zygotic (MZ) snx14Mut/Mut fish derived from snx14Mut/Mut female and snx14WT/Mut male pairs. (B) Maximum projected confocal images of heads (dorsal view) from 4dpf zebrafish embryos either snx14WT/Mut or MZ-snx14Mut/Mut. Staining employed immunohistochemistry against acetylated tubulin (green), marking axon tracts and SV2 (magenta) marking neuropil areas. (CE) Relative FA levels from whole body lysates of 4dpf zebrafish. Neutral lipid fraction-derived FA 16:0 (C), FA 18:1(n9) (D) and FA 20:4(n6) (E) were elevated in snx14Mut/Mut zebrafish compared to both snx14WT/WT and snx14WT/Mut zebrafish. (FH) Phospholipid fraction-derived FA 16:0 (F), FA 18:1(n9) (G) and FA 20:4(n6) (H) were elevated in both snx14Mut/Mut and snx14WT/Mut zebrafish compared to snx14WT/WT zebrafish. N = 3 (Pool of 6 zebrafish in each lysate), circles = individual lysate values, bars = mean, error bars = SD, **(p ≤ 0.01), n.s. (p ≥ 0.05), one-way ANOVA.

Acknowledgments
This image is the copyrighted work of the attributed author or publisher, and ZFIN has permission only to display this image to its users. Additional permissions should be obtained from the applicable author or publisher of the image. Full text @ Sci. Rep.