FIGURE SUMMARY
Title

Regenerating zebrafish fin epigenome is characterized by stable lineage-specific DNA methylation and dynamic chromatin accessibility

Authors
Lee, H.J., Hou, Y., Chen, Y., Dailey, Z.Z., Riddihough, A., Jang, H.S., Wang, T., Johnson, S.L.
Source
Full text @ Genome Biol.

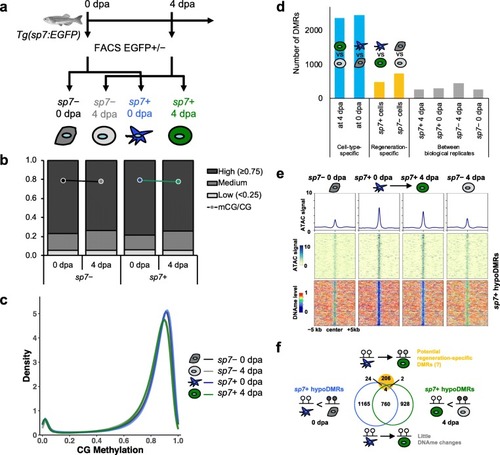
Lineage-specific DNA methylation signatures are stably maintained during fin regeneration. a Experimental scheme of sorting sp7+ and sp7− cells from uninjured and regenerating zebrafish fin by using FACS. b Global CpG methylation levels (mCG/CG) and fraction of total CpGs with low (< 25%), medium (≥ 25% and < 75%), and high (≥ 75%) methylation levels of sp7+ and sp7− cells during zebrafish fin regeneration. c Distribution of genome-wide CpG methylation levels of each cell type. Bimodal distribution of two CpG populations at high and low methylation levels is observed. d Number of DMRs identified between two biological replicates (gray bars), between two different time points in the same cell type (regeneration-specific, yellow bars) or between two different cell types at the same time point (cell-type-specific, blue bars). e ATAC-seq signals (top) and DNA methylation levels (bottom) over 10-kb regions centered on a total of 2883 sp7+ cell-specific hypoDMRs. Average ATAC-seq signals were plotted on top of each heatmap (line plots). f Venn diagram of sp7+ cell-specific hypoDMRs (blue and green circles for 0 dpa and 4 dpa, respectively) intersecting with potential regeneration-specific DMRs in sp7+ cells (yellow filled circle). Only 30 (1.0%) of sp7+ cell-specific hypoDMRs were predicted as potential regeneration-specific DMRs

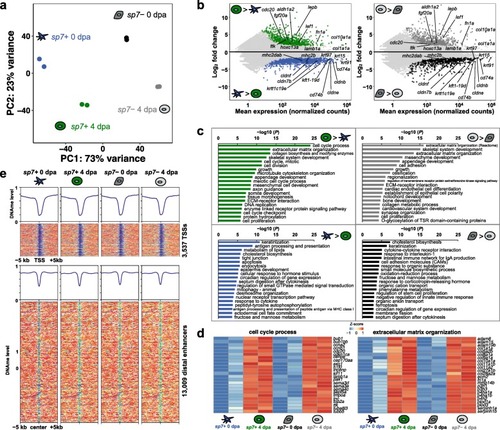
Regeneration-specific genes are activated independent of DNA methylation changes. a Principal component analysis on the transcriptomes of sp7+ and sp7− cells at 0 dpa uninjured fin and 4 dpa blastema. b MA plots for differentially expressed genes during fin regeneration in sp7+ and sp7− cells. Each dot represents log-transformed individual gene expression change. Green and dark gray dots represent statistically significantly upregulated genes during regeneration in sp7+ and sp7− cells, respectively (log2(FC) > 1 and FDR < 0.05). Blue and black dots represent genes statistically significantly downregulated genes during regeneration in sp7+ and sp7− cells, respectively (log2(FC) < − 1 and FDR < 0.05). Light gray dots represent genes with no significant changes. c Gene ontology (GO) terms associated with significantly differentially expressed genes. d Examples of expression pattern of upregulated genes during regeneration that fall within the top GO terms. e DNA methylation levels over 10 kb around the promoters and putative distal enhancers of the significantly differentially expressed genes during regeneration

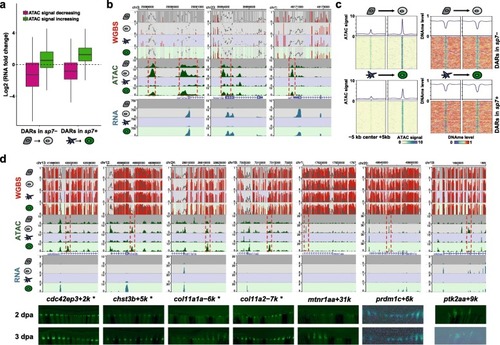
Regeneration-specific gene activation with gain of chromatin accessibility. a Expression fold changes for the genes with differentially accessible promoters during regeneration. b Epigenome browser views of genes whose activation is concordant with gain of chromatin accessibility of the promoter region (col1a1a, hoxc13a, and lef1). Red dashed boxes highlight ATAC peaks with increasing signals during regeneration. c ATAC-seq signals (left) and DNA methylation levels (right) over 10-kb regions centered on DARs with increasing signals in sp7+ (top heatmap) and sp7− cells (bottom heatmap) during regeneration. Average ATAC-seq signals and DNA methylation levels were plotted on top of each heatmap (line plots). d Identified candidates of regeneration-related enhancers and in vivo validations. Epigenome browser views of regeneration enhancers (top) and transgenic zebrafish carrying candidate sequence-driven reporter showing enhancer activities in the regenerating fin (bottom). Red dashed boxes indicate DARs that gained accessibility during regeneration. Asterisks indicate that F1 transgenic zebrafish line was established for a given enhancer element

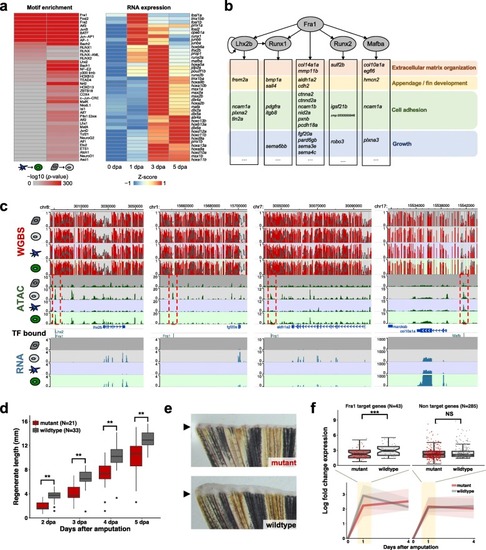
Gene regulatory networks identify upstream factors for fin regeneration. a Heatmaps showing the enriched TF binding motifs in DARs that gained accessibility in sp7+ and sp7− cells during fin regeneration (left) and of RNA expression of the corresponding TF genes (right). Motifs were sorted by binomial p value of enrichment in sp7+ cells. TF genes were clustered by their expression levels. b Putative gene regulatory network of the fin regeneration. The gray ovals are TFs whose motifs were highly enriched in DARs that gained accessibility during regeneration. The genes in the bottom boxes are the target genes of Fra1 and/or other TFs, identified by the footprint analysis. These target genes have biological functions relevant during fin regeneration as shown on the right. c Example Epigenome Browser views of Fra1, Lhx2, or Mafb motifs found in DARs, with their nearby target genes. Red dashed boxes indicate DARs that gained accessibility during regeneration. Motifs predicted to be bound by TFs were shown. d Boxplot showing fin regenerate lengths as a function of the time after amputation. Mutant (fosl1atw4/tw4) zebrafish (red) showed delayed regeneration after fin amputation compared to their wildtype littermates (gray). **p < 0.01; Mann–Whitney U test. e Representative pictures of the fin regenerate from the mutant (fosl1atw4/tw4) and their wildtype (fosl1a+/+) littermates at 2 dpa. Arrowhead, amputation plane. f RNA expression levels of the Fra1 target genes and non-target genes in the mutant (fosl1atw1/tw1) and their wildtype littermates. The predicted target genes of Fra1 were not upregulated as highly in mutant fish as in wildtype at 1 dpa (left), consistent with the delayed regeneration phenotype. Upregulated genes that were not Fra1 targets showed statistically no difference in the level of gene expression changes (right). Top boxplots show gene expression fold changes at 1 dpa. Bottom line plots show median gene expression fold changes across genes (line) in the time course. Shaded areas represent 25% and 75% quantiles. ***p < 0.001; Wilcoxon signed-rank test

Acknowledgments
This image is the copyrighted work of the attributed author or publisher, and ZFIN has permission only to display this image to its users. Additional permissions should be obtained from the applicable author or publisher of the image. Full text @ Genome Biol.