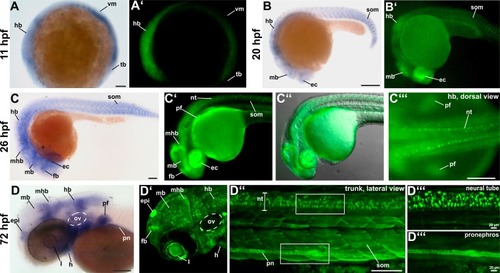
Comparison between endogenous <italic>tcf12</italic> mRNA expression detected by whole mount <italic>in-situ</italic> hybridization and EGFP expression in <italic>Tg(-2</italic>.<italic>1tcf12</italic>:<italic>EGFP)</italic> fish.

(A, A’) tcf12 transcripts are detectable by whole mount in-situ RNA hybridization at 11 hpf onwards in the hindbrain, ventral mesoderm, and tailbud. The expression pattern equals the first detectable EGFP signal in Tg(-2.1tcf12:EGFP) zebrafish. (B, B’) In-situ hybridization and transgenic embryos demonstrate tcf12 expression in the eyecups, midbrain, hindbrain, and somites at 20 hpf. (C) 26 hpf old zebrafish embryos show an additional tcf12 expression domain in the forebrain and the midbrain-hindbrain boundary. (C’, C”, C”‘) EGFP is also detected in the pectoral fin buds and in the neural tube of transgenic fish. (D, D’, D”; D”‘) In 72 hpf old fish tcf12 expression can, in addition, be detected in the epiphysis, the otic vesicle, the pronephros, and the heart. Images in D”‘ show magnifications of the neural tube and pronephros shown in D”. ec, eye cups; epi, epiphysis; fb, forebrain; h, heart; hb, hindbrain; hpf, hours post fertilization; l, lens; mb, midbrain; mhb, midbrain-hindbrain boundary; nt, neural tube; ov, otic vesicle; pf, pectoral fins; pn, pronephros; som, somites; tb, tailbud; vm, ventral mesoderm. All scale bars represent 100 μm unless otherwise stated.

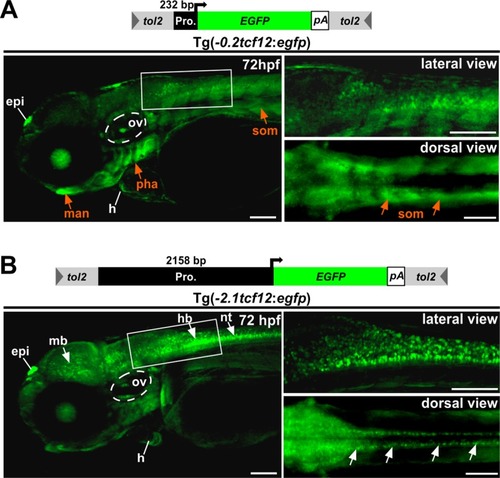
Comparison of EGFP expression in <italic>Tg(-0</italic>.<italic>2tcf12</italic>:<italic>EGFP)</italic> and <italic>Tg(-2</italic>.<italic>1tcf12</italic>:<italic>EGFP)</italic> fish.

Comparison between different tcf12:EGFP transgenic lines. (A) The minimal promoter driven Tg(-0.2tcf12:EGFP) individuals show strong EGFP expressions in the gills (Pharyngeal arches), the lower jaw (mandible) and the somites (orange arrows). These expression domains are absent or rather weak in Tg(-2.1tcf12:EGFP) fish (B). Tg(-2.1tcf12:EGFP) zebrafish show a strong EGFP signal in neurons of the mid- and hindbrain and the neural tube (white arrows in B), which are lacking in the Tg(-0.2tcf12:EGFP) animals. An EGFP expression in the heart, the otic vesicle, and the epiphysis is detectable in both transgenic lines. epi, epiphysis; h, heart; hb, hindbrain; hpf, hours post fertilization; man, mandible; mb, midbrain; nt, neural tube; ov, otic vesicle; pha, pharyngeal arches; som, somites. All scale bars represent 100 μm unless otherwise stated.

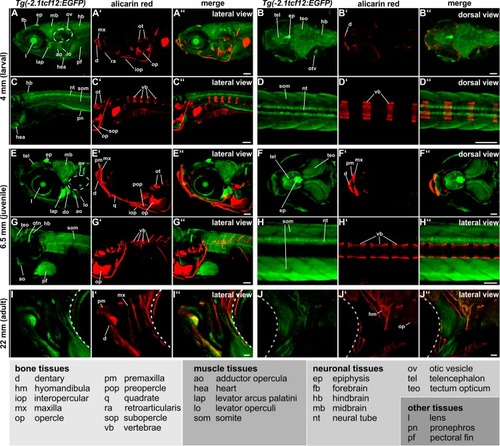
<italic>Tg(-2</italic>.<italic>1tcf12</italic>:<italic>EGFP)</italic> spatiotemporal EGFP expression during juvenile and adult stages.

Investigation of EGFP expression over time in vivo in 4 mm (larval, 11 dpf), 6.5 mm (juvenile, 27 dpf) and 18 mm (adult, 90 dpf) old Tg(-2.1tcf12:EGFP) individuals via confocal imaging. Skeletal structures were stained with alizarin red. The tcf12 expression profile can be split into three main tissue groups: bone, muscular, and neuronal. Besides these tissues, expression in the lens, pronephros, and pectoral fins is detected. Abbreviations can be found in the legend. All scale bars represent 100 μm. dpf, days post fertilization.

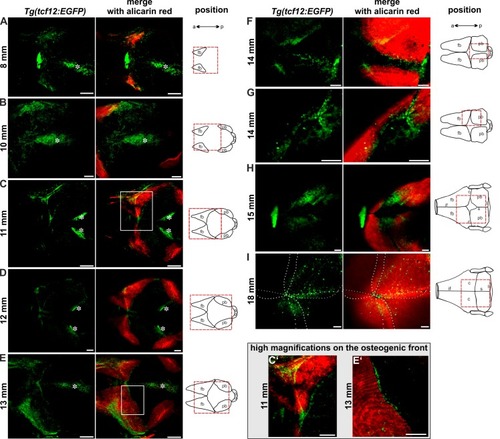
Expression of EGFP in <italic>tcf12</italic>:<italic>EGFP</italic> reporter lines during growth of calvarial bones and cranial suture patterning.

Dorsal views of 8–18 mm (30–90 dpf) zebrafish skull vaults are depicted. Mineralized structures were stained with alizarin red. The schemes illustrate the growth stage of the calvarial bones. Red squares enclose the regions of the calvaria that are shown on the confocal images. EGFP signals in the center of the developing skull plates in A-E derive from the overlaying skin (marked with asterisk). C’ and E’ show detail magnifications of the boxed regions in C and E. The images display maximum intensity Z-projections from confocal stacks. Dashed white lines in I indicate fronts of the overlapping frontal and parietal bones. a, anterior; c, coronal suture; fb, frontal bone; if, interfrontal suture; l, lambdoid suture; p, posterior; pb, parietal bone; s, sagittal suture; sop, supraoccipital. All scale bars represent 100 μm.

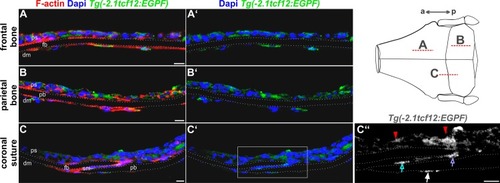
Cryosections of the calvaria reveal precise localization of <italic>tcf12</italic>:EGFP-expressing cells.

Confocal images of immunostaining on cryosections of the frontal and parietal bones and the coronal sutures of adult Tg(-2.1tcf12:EGFP) fish. Specimens were stained with anti-GFP (green) and counterstained with Phalloidin (F-actin, red) and DAPI (blue) for visualization of cell structures and nuclei. Sections of the frontal (A) and parietal (B) bones reveal tcf12:EGFP expressing cells in the periosteum and dura mater. (C) Section of the coronal suture unveils a GFP expression in the periosteum (red arrows in C”) and dura mater, too (white arrow in C”). A detail magnification (C”) unveils an additional GFP expression in the suture mesenchyme of the coronal suture (blue arrow in C”) and at the tip of the osteogenic front of the frontal plate (purple arrow in C”).The dashed lines in the scheme mark the area of the cryosections shown in A-C”. a, anterior; dm, dura mater; fb, frontal bone; p, posterior; ps, periosteum; pb, parietal bone; sm, suture mesenchyme. All scale bars represent 10 μm.

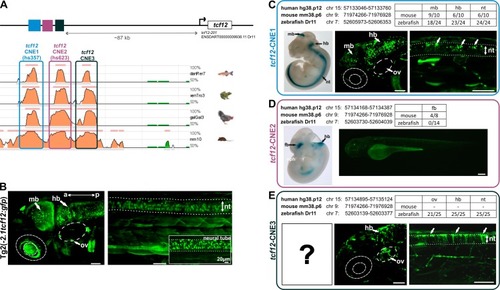
<italic>In vivo</italic> studies of evolutionarily conserved non-coding elements (CNEs) near the <italic>tcf12</italic> locus identified two enhancer elements that drive specific neuronal expression.

(A) Graphic representation of the location of tcf12-CNE1-3 located ~87 kb 5’ of the tcf12 gene (transcript tcf12-201 ENSDART00000009938.11) and interspecies alignments using the ECR browser [39]. (B) Fluorescent images of head and trunk of the Tg(-2.1tcf12:EGFP) line. (C to E) Comparison of the expression pattern of whole-mount lacZ staining of transgenic mice embryos from the VISTA Enhancer Browser [22] with fluorescent images of transient transgenic zebrafish embryos expressing tcf12-CNE1, tcf12-CNE2 or tcf12-CNE3. Genomic locations of the CNEs in human, mouse, and zebrafish are indicated. The table summarizes the number of mice and fish analyzed with the number of different expression pattern detected. Dotted lines mark the boundaries of the neural tube. a, anterior; hb hindbrain; mb, midbrain; nt, neural tube; ov, otic vesicle; p, poserior. All scale bars represent 50 μm unless otherwise stated.

EXPRESSION / LABELING:
Gene:
Fish:
Anatomical Terms:
Stage: Protruding-mouth

Suture visualization in zebrafish.

Alizarin red staining was performed at different stages of development (A: 15 mm, 50 dpf; B: 26 mm, 120 dpf; C: 36 mm, 280 dpf/adult) and showed calvarial plate growth and progression of suture establishment over time. Dorsal views are maximum intensity Z-projections from confocal stacks.

Acknowledgments
This image is the copyrighted work of the attributed author or publisher, and ZFIN has permission only to display this image to its users. Additional permissions should be obtained from the applicable author or publisher of the image. Full text @ PLoS One