- Title
-
Whole organism small molecule screen identifies novel regulators of pancreatic endocrine development
- Authors
- Helker, C.S.M., Mullapudi, S.T., Mueller, L.M., Preussner, J., Tunaru, S., Skog, O., Kwon, H.B., Kreuder, F., Lancman, J.J., Bonnavion, R., Dong, P.D.S., Looso, M., Offermanns, S., Korsgren, O., Spagnoli, F.M., Stainier, D.Y.R.
- Source
- Full text @ Development
|
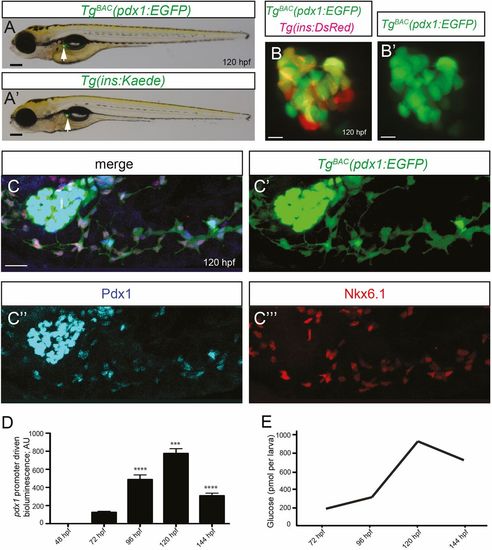
pdx1 expression in β-cells and ductal cells. (A,A′) Visualization of TgBAC(pdx1:EGFP)expression. A 200 kb pdx1 BAC drives EGFP expression specifically in the pancreatic islet (arrows). Pancreatic β-cell-specific reporter signal in Tg(ins:Kaede) larva is shown for comparison. (B,B′) Confocal images of the pancreatic islet of a 120 hpf TgBAC(pdx1:EGFP); Tg(ins:DsRed) larva showing β-cell TgBAC(pdx1:EGFP) expression. (C-C?) Confocal images of the pancreas of a 120 hpf TgBAC(pdx1:EGFP) larva immunostained for GFP, Pdx1 and Nkx6.1 showing colocalization of TgBAC(pdx1:EGFP) expression with endogenous Pdx1. (D) Dynamics of pdx1promoter activity over time as measured by TgBAC(pdx1:luciferase) activity. The TgBAC(pdx1:luciferase) signal starts to become detectable at 72 hpf, peaks at 120 hpf and decreases by 144 hpf. (E) At the peak of the TgBAC(pdx1:luciferase) signal, whole-body free-glucose levels start to decrease, indicating β-cell function. AU, arbitrary units. ***P≤0.001, ****P≤0.0001. Error bars represent s.e.m. Scale bars: 200?µm (A); 8?µm (B,B′); 20?µm (C).
|
|
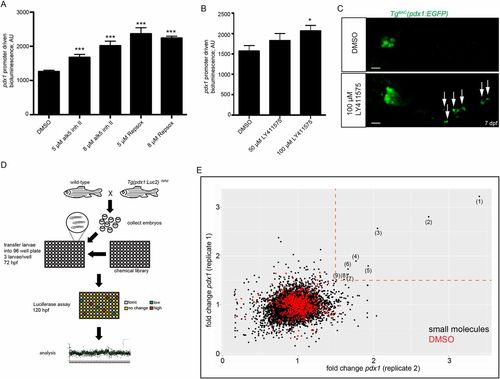
Whole organism screen for modulators of pdx1 expression. (A) Forty-eight-hour treatment of 72?hpf TgBAC(pdx1:Luc2) larvae with two TGFβ inhibitors (alk5 inh II and Repsox), which increase pdx1 mRNA levels in human islets, leads to an increase in luciferase activity. (B) Forty-eight-hour treatment of 72?hpf TgBAC(pdx1:Luc2) larvae with the γ-secretase inhibitor LY411575, which leads to increased differentiation of β-cells, increases luciferase activity. (C) Ninety-six-hour treatment of 72?hpf TgBAC(pdx1:EGFP) larvae with LY411575 leads to secondary islet formation as marked by TgBAC(pdx1:EGFP) expression (arrows). (D) Establishment of a high-throughput screening pipeline. Mating wild-type zebrafish with homozygous TgBAC(pdx1:Luc2)reporter zebrafish generates clutches of 100% hemizygous embryos. At 72?hpf, three larvae were transferred to each well of a 96-well plate and incubated for 48?h with a specific compound at 10?µM. At 120?hpf, each plate was incubated with long half-life luciferin and the bioluminescence intensity of each well measured in a standard plate reader. (E) Results of the primary screen. Differential pdx1 promoter-driven luciferase activity by small molecules of both duplicates is shown. A total of 8256 compounds from nine bioactive small molecule libraries were screened in duplicate. Each axis represents the levels of pdx1 reporter expression fold change from one of the duplicates. Dashed orange lines indicate 1.5-fold change. Red dots, negative control (1% DMSO); black dots, small molecules. (1) XL147; (2) SKF-86055; (3) chaulmoogric ethyl ester; (4) VPA; (5) HC toxin; (6) SB-736290; (7) PD168493; (8) scriptaid; (9) 2′,3′-O-isopropylideneadenosine. *P≤0.05, ***P≤0.001. Error bars represent s.e.m. Scale bar: 20?µm.
|
|
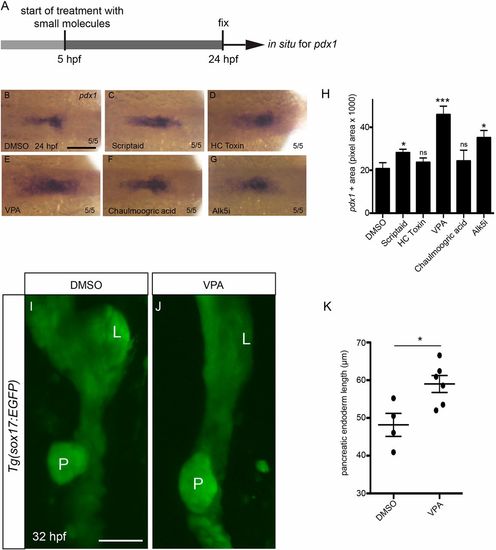
The HDAC inhibitor VPA increases pancreatic endoderm at the expense of hepatic endoderm. (A) Schematic of the experimental set up. (B-G) In situ hybridization on 24?hpf embryos showing pdx1 expression. (H) Scriptaid, VPA and Alk5i treatment lead to an increase in the pdx1-positive area. (I,J) Confocal images of 32?hpf Tg(sox17:EGFP) embryos treated with DMSO (I) as control or VPA (J). L, liver; P, pancreas. (K) VPA treatment leads to an increase in pancreatic endoderm area. ns, not significant. *P≤0.05, ***P≤0.001. Error bars represent s.e.m. Scale bars: 100?µm (B); 20?µm (I).
|
|
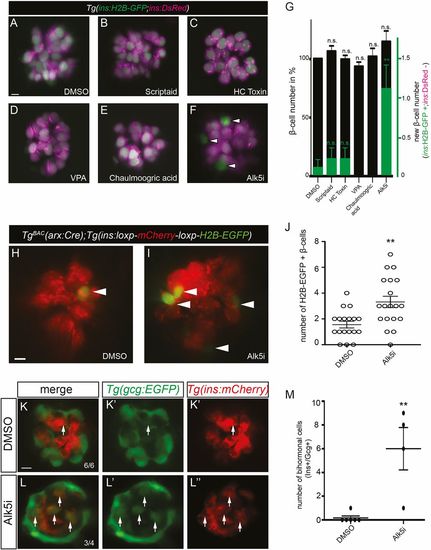
Alk5 inhibition increases β-cell mass by transdifferentiation of α-cells to β-cells.(A-F) Confocal images of 120?hpf Tg(ins:H2B-GFP;ins:DsRed) larvae used to count β-cells. Tg(ins:H2B-GFP;ins:dsRED) larvae treated with DMSO (A), scriptaid (B), HC toxin (C), VPA (D), chaulmoogric acid (E) or Alk5i (F) from 72 to 120?hpf. Newly differentiated β-cells, labeled by H2B-GFP expression but negative for DsRed expression, are marked by arrowheads. (G) None of the treatments leads to a significant increase in total β-cell numbers. Alk5 inhibition leads to an increase of newly differentiated β-cells. (H,I) Confocal images of 120?hpf TgBAC(arx:Cre);Tg(insulin:loxP:mCherrySTOP:loxP:H2B-GFP) larvae used to count α-cell-derived β-cells (arrowheads). (J) Alk5 inhibition leads to an increased number of H2B-EGFP positive β-cells. (K-L″) Confocal images of 120?hpf Tg(gcg:EGFP); Tg(insulin:mCherry) larvae used to count bihormonal endocrine cells (arrows). (M) Alk5 inhibition leads to an increased number of bihormonal endocrine cells. n.s., not significant. **P≤0.01. Error bars represent s.e.m. Scale bars: 5?µm (A,H); 7?µm (K).
|


