- Title
-
RAS at the Golgi antagonizes malignant transformation through PTPRκ-mediated inhibition of ERK activation
- Authors
- Casar, B., Badrock, A.P., Jiménez, I., Arozarena, I., Colón-Bolea, P., Lorenzo-Martín, L.F., Barinaga-Rementería, I., Barriuso, J., Cappitelli, V., Donoghue, D.J., Bustelo, X.R., Hurlstone, A., Crespo, P.
- Source
- Full text @ Nat. Commun.
|
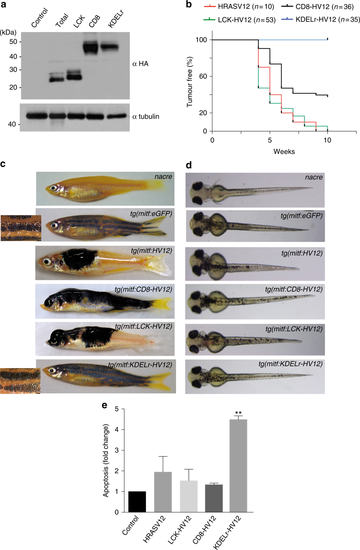
Oncogenic effects of activated RAS at the GC. a Expression of the indicated constructs transfected (1??g) in CHL melanocytes. b Kaplan?Meier plot of the Incidence of melanoma by 10 weeks post fertilization in nacre zebrafish expressing the indicated HRASV12 site-specific transgenes using the miniCoopR system. c Representative images of adult zebrafish expressing the indicated HRASV12 site-specific transgenes at 8 weeks post fertilization compared to nacre. Insets are magnification of stripes. d Representative images of zebrafish embryos expressing the indicated HRASV12 site-specific transgenes at 3 days post fertilization compared to uninjected nacre. e Apoptosis induction by the indicated HRASV12 site-specific constructs in CHL melanoma cells. Results, relative to the values found in vector-transfected cells, show average?±?SEM from three independent experiments **p?<?0.01 by Student's t-test. See also Supplementary Fig. 7 |
|
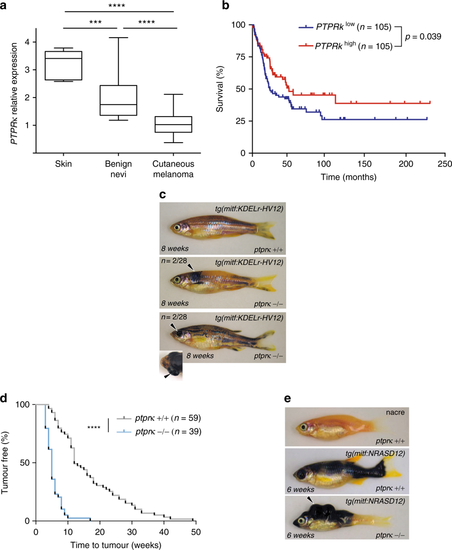
PTPR? is a tumor suppressor in melanoma. a Analysis of PTPR? expression in normal skin (n?=?7), benign nevi (n?=?18) and cutaneous melanoma samples (n?=?45) generated using an available gene dataset, accessed through the Oncomine® platform. ***p?<?0.001 ****p?<?0.0001 by Student's t-test. b Survival curves for melanoma patients depending on PTPR? expression levels (obtained from GEO GSE65904). c View of naevi (2/28; arrowhead, middle panel) and melanoma (2/28; arrowhead bottom panel, points to a protruding eye with a retroorbital tumor.) by 52 weeks post fertilization in ptpr? nullizygous zebrafish expressing KDELr-HV12 as a transgene. Representative pictures were taken at 8 weeks post fertilization. d Kaplan?Meier plot of tumor development in ptpr? wild-type nacre animals compared to ptprk?/? nacre animals, injected with NRAS-G12D. ****p?<?0.0001 by Mantel-Cox test. e Representative melanoma lesions (see arrowheads) in zebrafish with the indicated ptpr? genotype expressing NRAS-G12D as a transgene. See also Supplementary Fig. 8 |
|
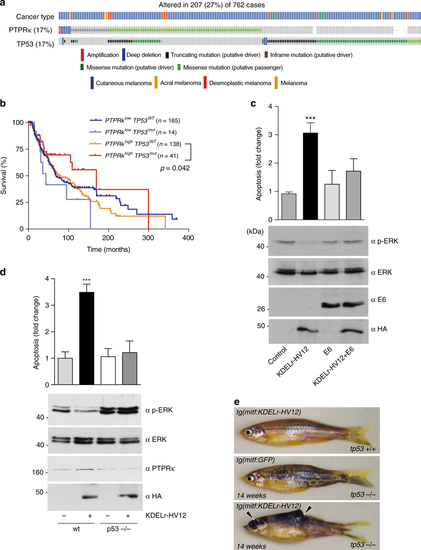
TP53 status determines GC RAS-induced melanomagenesis. a Analysis of PTPR? and TP53 mutational status generated using the TCGA dataset accessed through the cBioPortal for Cancer Genomics platform. b Survival curves for melanoma patients depending on PTPR? expression levels and tp53 mutational status (obtained from TCGA melanoma dataset). c Effects of TP53 inactivation on ERK phosphorylation and apoptosis induced by GC RAS signals, as revealed in MCF-7 cells transfected with the indicated constructs. Data show average?±?SEM from three independent experiments. ***p?<?0.005 by Student's t-test. d Effects of TP53 status on ERK phosphorylation and apoptosis induced by GC RAS signals, as revealed in MEFs, wild-type (wt) and tp53-null,transfected with KDELr-HV12 (1??g) where shown (+). Data show average?±?SEM from three independent experiments. ***p?<?0.005 by Student's t-test. e tp53 inactivation is sufficient to promote melanomagenesis by GC RAS signals. Arrowheads show melanoma lesions in tp53?/? zebrafish expressing the KDEL-HV12 transgene after 14 weeks. See also Supplementary Fig. 9 |
|
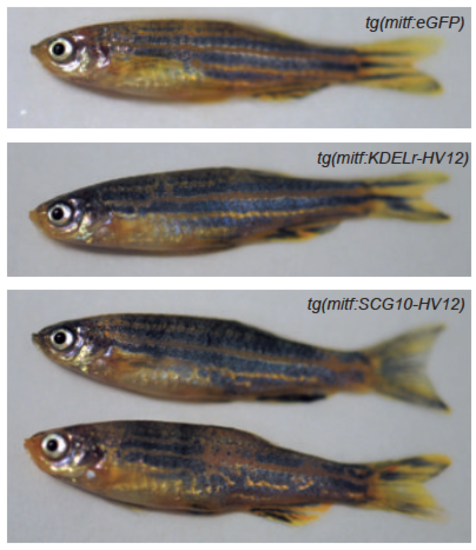
Macroscopic view of representative fish expressing the indicated HRASV12 site-?specific transgenes after 14 weeks. |

ZFIN is incorporating published figure images and captions as part of an ongoing project. Figures from some publications have not yet been curated, or are not available for display because of copyright restrictions. |

Unillustrated author statements PHENOTYPE:
|


