- Title
-
Simultaneous B and T cell acute lymphoblastic leukemias in zebrafish driven by transgenic MYC: implications for oncogenesis and lymphopoiesis
- Authors
- Borga, C., Park, G., Foster, C., Burroughs-Garcia, J., Marchesin, M., Shah, R., Hasan, A., Ahmed, S.T., Bresolin, S., Batchelor, L., Scordino, T., Miles, R.R., Te Kronnie, G., Regens, J.L., Frazer, J.K.
- Source
- Full text @ Leukemia
|
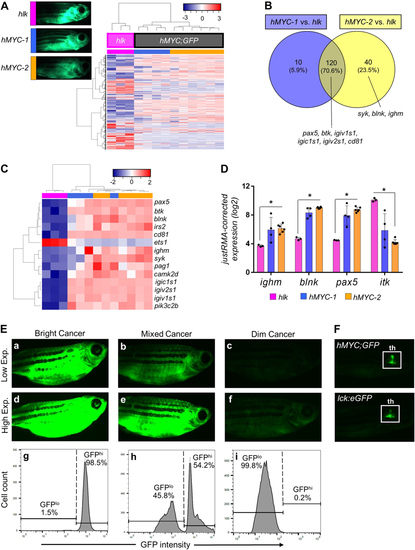
Two ALL types inhMYC zebrafish with differing fluorescence intensities. AUnsupervised analysis of 10 hMYC (grey) and 3 hlk (magenta) ALL, using highest-variance probes. hMYC ALL cluster into hMYC-1 (blue) and hMYC-2 (orange) groups. Representative fluorescent images of fish with ALL from each group shown at upper left. B Venn diagram of 170 over-expressed genes in hMYC ALL compared to hlk T-ALL. Genes up-regulated by both hMYC-1 and −2 (n = 120) reside in the intersection, including six B cell-specific genes listed below the Venn diagram. Three other B cell-specific genes over-expressed by only hMYC-2 ALL are listed below the yellow circle. C Unsupervised analysis using B cell-specific genes. D Expression of ighm, blnk, pax5and itk in hlk, hMYC-1 and hMYC-2 ALL. Each gene is significantly differentially expressed in hlk T-ALL vs. hMYC-2 ALL (Mann–Whitney test, *p-value < 0.05). Expression values are log2 scale, normalized against the entire microarray dataset using the justRMA algorithm. Results shown as mean values ± standard deviation (S.D.). E Left: “bright” ALL, shown using low and high exposure settings (a, d). Cells are GFPhi by flow cytometry (g). Right: “dim” ALL, using low and high (c, f) exposures. Cells are GFPlo (i). Center: Fish with mixed-ALL (b, e), with discrete GFPlo and GFPhipopulations (h). F Images of control hMYC;GFP (upper) and lck:eGFP (lower) fish with only thymic (th) fluorescence
|
|
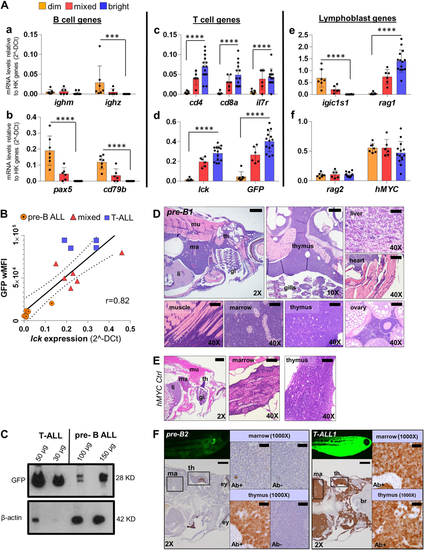
GFP fluorescence intensity of hMYC ALL correlates with B vs. T cell lineage. A qRT-PCR of ALL with differing GFP fluorescence (dim, n = 7; mixed, n = 6; bright, n = 14) of B cell-specific (ighm, ighz, pax5, cd79b; a–b), T cell-specific (cd4, cd8a, il7r, lck; c-d), lymphoblast- specific (igic1s1, rag1, rag2; e–f) genes and transgenes (GFP, d; hMYC, f). Results are normalized to housekeeping (HK) genes (β-actin and eef1a1l1) and shown as mean values ± S.D. Significant differences are indicated (Mann–Whitney test, p-values: ***<0.001, ****<0.0001). B Spearman correlation (p-value 0.0002, r = 0.82, r2 = 0.74) between lck vs. wMFI for: 7 B-ALL (circles), 6 mixed (triangles), and 4 T-ALL (squares). The solid line represents linear regression; dashed lines denote 95% confidence intervals. C Anti-GFP (#sc-9996) and anti-β-actin (#ab8227) WB of FACS-purified T- and pre-B ALL. D H&E of pre-B ALL infiltration in different sites and E hMYC control. F Anti-GFP (#GTX20290) IHC of hMYC pre-B ALL (pre-B2, left) and T-ALL (T-ALL1, right). 1000× images show staining with or without anti-GFP (Ab+; Ab-). th= thymus, ma= marrow, li= liver, mu= muscle, gi= gills, ey= eye, br= brain. 2× scale bar = 500 µm; 10× bar = 100 µm; 40× bar = 50 µm; 1000× bar = 20 µm
|
|
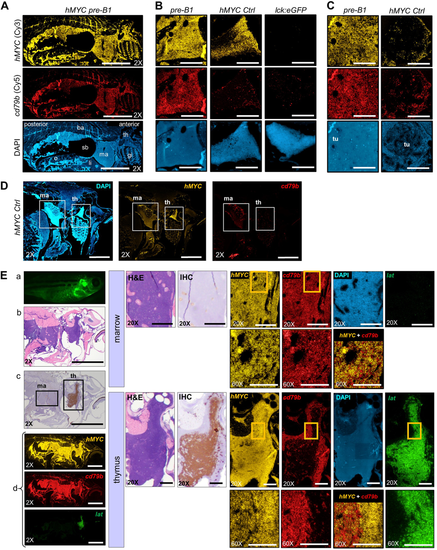
Pre-B ALL co-express hMYC and B cell-specific cd79b. RNA ISH for hMYC (yellow) and cd79b (red) in: A sagittally-sectioned hMYC pre-B ALL (pre-B1; scale bar = 2 mm), B Thymi of pre-B1 (left), hMYC control (center), and lck:GFP (WT) control (right; scale bar = 200 μm), C Kidney-marrow of pre-B1 (left) and hMYC control (right). Kidney tubules (tu) are displaced by pre-B1ALL cells in marrow DAPI image (scale bar = 200 μm), D hMYC control (scale bar = 1 mm). E Second hMYC fish with pre-B ALL and localized thymic T-ALL. Left: (a) High-exposure microscopy, (b) H&E, (c) anti-GFP IHC, (d) RNA ISH for hMYC (yellow), cd79b (red) and lat (green). Middle: high-power of kidney-marrow (top) and thymus (bottom) by H&E, anti-GFP IHC. Right:hMYC, cd79b, and lat, RNA ISH. Boxed regions in 20X marrow and thymus panels are enlarged in the 60× images directly beneath them. Merged hMYC+cd79b images are also shown. 2× scale bar = 2 mm; 20× bar = 200 µm; 60× bar = 100 µm. Abbreviations as in Fig. 3, and o= ovary, ba= back, sb= swim bladder
EXPRESSION / LABELING:
|
|
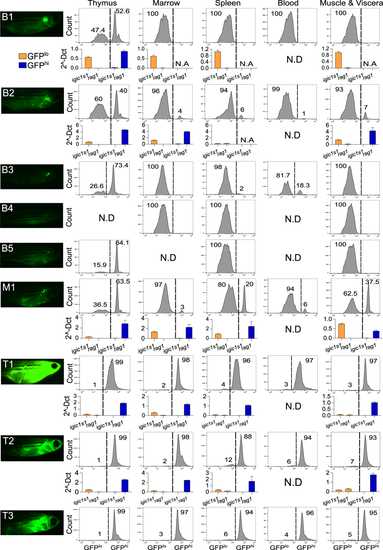
GFP intensity and igic1s1/rag1 distinguish pre-B vs. T-ALL in each anatomic site. Left column shows high-exposure fluorescent microscopy of 4 month-fish with pre-B ALL (B1-5), mixed ALL (M1), or T-ALL (T1-3). Panels at right show flow cytometric analysis of GFPlo and GFPhi cells of thymus, marrow, spleen, peripheral blood, and muscle & abdominal viscera. Each panel shows % of GFPlo vs. GFPhi cells in the entire GFP+ gate; 105 events from the lymphoid/precursor gate were analyzed for each plot. N.D.= not determined. Histograms depict expression of igic1s1 and rag1 by qRT-PCR in five hMYC fish with pre-B ALL (B1, B2), mixed ALL (M1) or T-ALL (T1, T2). Results are normalized to housekeeping genes (β-actin and eef1a1l1) and shown as mean + Standard Error (S.E.). N.A.= not available due to insufficient cells for RNA extraction
|


