- Title
-
Storage of neural histamine and histaminergic neurotransmission is VMAT2 dependent in the zebrafish
- Authors
- Puttonen, H.A.J., Semenova, S., Sundvik, M., Panula, P.
- Source
- Full text @ Sci. Rep.

ZFIN is incorporating published figure images and captions as part of an ongoing project. Figures from some publications have not yet been curated, or are not available for display because of copyright restrictions. PHENOTYPE:
|
|
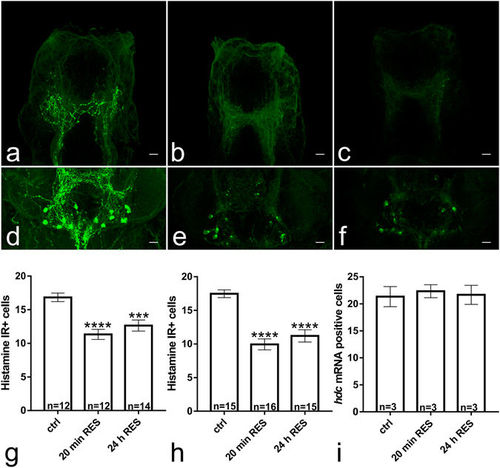
The larvae treated with 40?mg/L reserpine for 20?min (b) and 24?h (c) showed a clearly diminished number of histamine immunoreactive fibers in the telencephalon compared with controls (a) 72?h after administration of reserpine. A similar effect was seen in the hypothalamus, where larvae in the 20?min (e) and 24?h (f) treated groups had a clearly diminished number of histamine immunoreactive cells in comparison to controls (d). Some cell bodies showing clear immunoreactivity were still seen in both treatment groups. The dense network of hypothalamic histamine fibres (as seen in d) was also not present in the reserpine treated fish (e,f). The staining pattern observed was similar at 24?h after administration of reserpine (data not shown). In order to quantify the effect on the cell population, the number of cells showing clear cytoplasmic histamine immunoreactivity was counted at 24?h and 72?h after administration of reserpine (g,h, respectively). At all time points, the number of cells was significantly decreased by 30?40%. In order to verify that the reduction in histamine immunoreactivity was not due to destruction of histamine neurons, we counted the number of hdc mRNA positive cells in brains collected 72?h after administration of reserpine (i). No difference was seen between reserpine treated and control brains, indicating that the histamine neurons were intact. Statistical analyzes were done using 1-way ANOVA (g,i), followed by Tukey?s multiple comparison tests, respectively. Data are presented as mean?▒?SEM. ***p?<?0.001, ****p?<?0.0001 according to the multiple comparison test, in comparison with the control group. Scale bar 10?Ám. The brains are in a horizontal orientation, with the anteroposterior axis pointing upwards. |
|
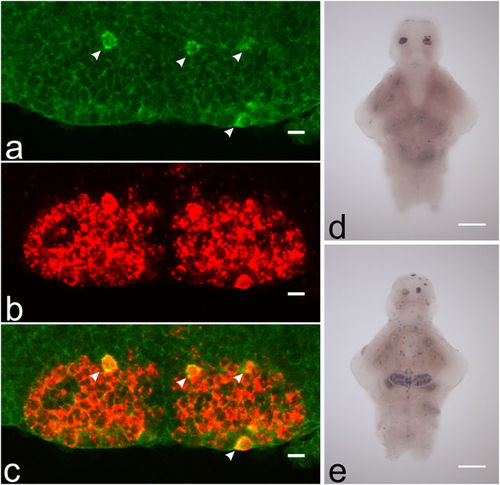
Expression of vmat1, vmat2 and hdc in the hypothalamus. Virtually all hdc mRNA positive neurons seen (green, pointed out by white arrows) also express vmat2 mRNA (red) (a?c). n?=?6 brains, representative single optical sections from one sample are shown. Red signal is developed using TAMRA tyramide and green signal using DY-647P1 tyramide. We found no expression of vmat1 in the zebrafish brain (d), although vmat2 was present in multiple brain regions (e). Scale bar 10?Ám for (a?c) and 100?Ám for (d?e). |


