- Title
-
Peripheral glia have a pivotal role in the initial response to axon degeneration of peripheral sensory neurons in zebrafish
- Authors
- Pope, H.M., Voigt, M.M.
- Source
- Full text @ PLoS One
|
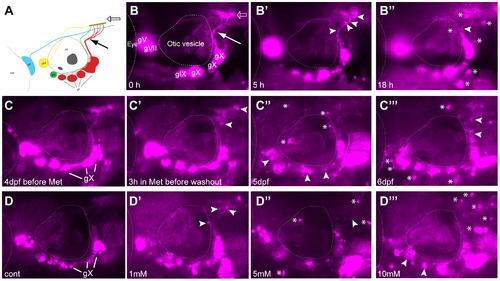
Metronidazole treatment in 4 days post fertilization (dpf) Ntr larvae. A) Diagram of expression pattern of p2rx3.2(4.0):gal4vp16;UAS:nsfB-mcherry (referred to as Ntr). Projection of axons indicated with closed arrow. Terminal field in hindbrain (plexus) labeled with open arrow. B) Epifluorescent image of 4 dpf Ntr with labeling as in A. Projections of axons indicated with closed arrow; plexus indicated with open arrow. Select images from a time lapse video of 4 dpf Ntr in 10 mM Met at B) 0 hr, B′) 5 hr, and B′′) 18 hr. Puncta along axons (arrowheads) was seen at 5 hrs. By 18 hrs, motile cells containing cellular debris (asterisks) were seen around the ganglia and axons. C) 4 dpf Ntr imaged before Met treatment and C′) after 3 hrs in 10 mM Met (arrowheads point to puncta in axons). Met was then washed out of the larva, followed by imaging at C′′) 5 dpf and C′′′) 6 dpf (arrowheads point to degenerating ganglia and axons; asterisks indicate red motile cells containing debris). Same fish imaged at each time point. D) Dose response of 4 dpf Ntr given fish water (control vagal ganglia labeled gX), D′) 1 mM, D′′) 5 mM, or D′′′) 10 mM Met overnight for 18 hrs, followed by imaging at 5 dpf. Arrowheads point to degenerating ganglia and axons; asterisks indicate debris. Anterior is to the left; dorsal is at the top. Eye and otic vesicle (OV) are outlined. Cranial sensory ganglia labeled gV, gVII, gIX, and gX in panels A,B; vagal ganglia labeled gX in panels C,D. |
|
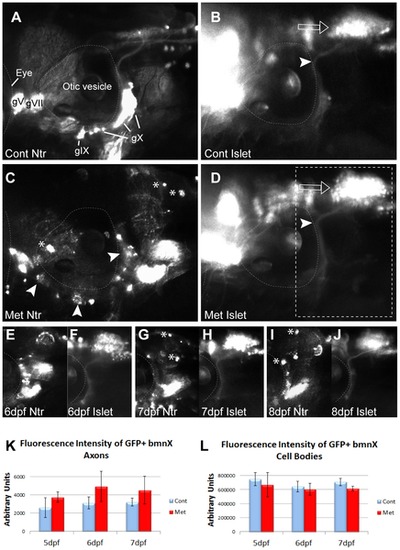
Metronidazole does not have a bystander effect. A,B) 4:gfp;Ntr incubated in fish water (control) for 18 h and imaged at 5 dpf. A) Ntr-expressing sensory neurons. B) Isl1:gfp-expressing branchiomotor neurons (bmn). Arrowhead indicates axons; open arrow indicates motor cell bodies in hindbrain. C,D) 4 dpf Isl1:gfp;Ntr treated with 10 mM Met for 18 h and imaged at 5 dpf. C) Ntr-expressing sensory neurons/axons degenerate. Arrowheads point to degenerating cell bodies; asterisks indicate mCherry-containing debris. D) Isl1:gfp-expressing bmn remain intact while sensory neurons contributing to the same nerve degenerate. Open arrow points to motor neuron cell bodies; arrowhead indicates motor axons. Outlined box indicates region of focus in E?J. E?J) 4 dpf Islet:gfp;Ntr kept in 10 mM Met and imaged for 3 consecutive days. E) 6 dpf Ntr; F) 6 dpf Isl1:gfp; G) 7 dpf Ntr; H) 7 dpf Isl1:gfp; I) 8 dpf Ntr; J) 8 dpf Isl1:gfp. Water changes containing fresh Met were performed each day after imaging. Asterisks indicate some of the debris containing mCherry seen after Met-treatment. Met had no significant effect on Islet-expressing bmn, while Ntr-expressing sensory neurons contributing to the same nerve degenerated. K,L) Quantitation of fluorescence intensity of isl1:gfp bmn axons (K) and cell bodies (L) from individual larvae maintained in 10 mM Met for 3 days showed no change in fluorescence during peripheral sensory axon degeneration. Fluorescence intensity was quantitated using ImageJ, with the same region of interest used for each analysis. Integrated density, area, mean and background fluorescence were measured and from these values, corrected total cell fluorescence (given in arbitrary units) was calculated (n = 3 larvae/treatment group) and analyzed (t-test). Eye is outlined in A?D, otic vesicle outlined in all panels. Cranial ganglia labeled gV, gVII, gIX and gX. Anterior to left, dorsal at top for all panels. |
|
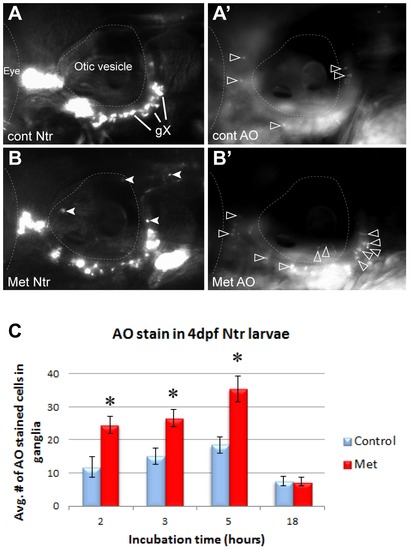
Metronidazole caused neuronal cell death in Ntr-expressing cells. A) 4 dpf Ntr incubated in fish water (control) for 5 hr, followed by A′) staining and imaging with Acridine Orange (AO). AO-stained cells indicated with open arrowheads. B) 4 dpf Ntr treated with 10 mM Met for 5 hr (closed arrowheads indicate puncta in axons and debris containing mCherry), followed by B′) AO staining and imaging. Open arrowheads indicate AO stained cells. C) 4 dpf Ntr treated with 10 mM Met for various times, followed by AO staining, imaging, and counting in the ganglia. Graph indicates the average number of AO-stained cells in the ganglia for each treatment group at 2 h (control 11.75±3.14 cells, n = 12 and Met 24.54±2.67 cells, n = 24, p<0.05), 3 h (control 15.05±2.35 cells, n = 20 and Met 26.55±2.61 cells, n = 29, p<0.05), 5 h (control 18.44±2.35 cells, n = 16 and Met 35.48±3.85 cells, n = 24, p<0.05), and 18 h (control 7.54±1.4 cells, n = 21 and Met 7.46±1.22 cells, n = 21, ns). There was a significant increase in cell death during the first few hours in Met (2?5 hr), but not after 18 hr. ns, not significant.. For each image, anterior is to the left; dorsal is at the top. Eye and otic vesicle (OV) are outlined, vagal ganglia labeled gX in panel A. |
|
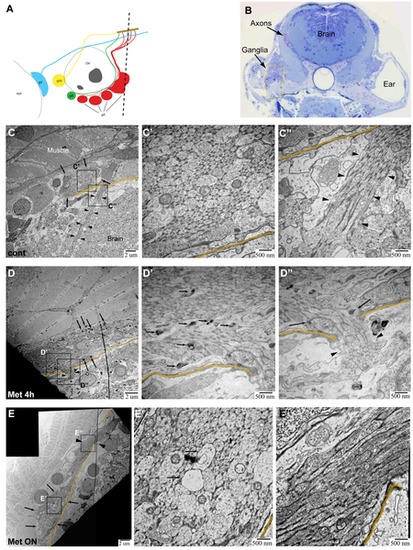
TEM images of axons in Ntr larvae. A) Diagram of ganglia and axons. Dotted line indicates location of transverse sections in 4 or 5 dpf larvae. B) Representative Toluidine Blue (TB) stained transverse section shows location of axons (magenta) and ganglia (orange) in 5 dpf larvae. C,C′,C′′) 5 dpf untreated Ntr. C) Cross section of axon bundle (arrows) and longitudinal view of axons (arrowheads) entering hindbrain (6000x). Boundary between brain and periphery (basement membrane) indicated in orange in all images. C′) Cross section of axons (30,000x). Small and medium diameter axons are visible. C′′) Longitudinal view of parallel axons entering brain (arrowheads) (30,000x). D,D′,D′′) 4 dpf Ntr treated with 10 mM Met for 4 h. D) Cross section of axon bundle and longitudinal view of axons (arrowheads) entering hindbrain (7500x). Electron-dense puncta (arrows) are seen at this magnification. D′) Cross section of axon bundle (30,000x). Damaged axons containing dark puncta (arrows). D′′) Axons entering brain (arrowheads) show dark puncta (arrows) (30,000x). E,E′,E′′) Ntr at 5 dpf after 18 hr-treatment with 10 mM Met. E) Cross section of axon bundle (arrows) and longitudinal view of axons (arrowheads) entering hindbrain (7500x). E′) Cross section of axon bundle (30,000x). Individual axons (arrows) appear empty and have few microtubules and neurofilaments. E′′) Axons entering brain (30,000x) appear darker and are more electron-dense than control axons (compare to C′′). |
|
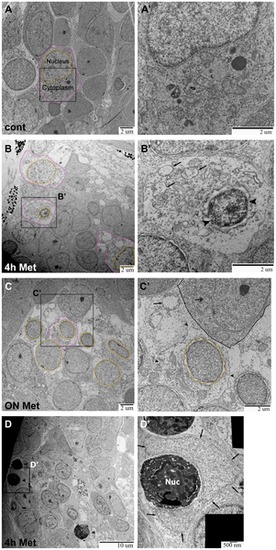
TEM images of ganglia in Ntr larvae. A,A′) Ganglia in 5) Individual cell indicated with nucleus (orange) and cytoplasm (magenta) outlined (7500x). A′) Higher magnification of A (15,000x) shows a normal cell. B,B′) Ganglia in 4 dpf Ntr treated with 10 mM Met for 4 h. B) Degenerating cell bodies (nuclei in orange; cytoplasm in magenta) are apparent at this magnification (7500x). B′) Higher magnification of B (15,000x) shows one of these damaged cells. The nucleus (arrowheads) has shrunk and organelles in the cytoplasm (arrows) appear damaged. C,C′) Ntr at 5 dpf after 18 hr- treatment with10 mM Met. C) Damaged cells lacking discreet cell membranes (nuclei in orange) are apparent at this magnification (7500x). Individual cell outlined in magenta. C′) Higher magnification image of C (15,000x) shows one of these damaged cells. The nucleus (orange) appears ruffled and the cell membrane is broken (arrowheads) and irregular. A neighboring healthy cell is indicated (dashed line) containing a normal organelle (double arrow). For comparison, a swollen organelle from a degenerated cell is indicated with an arrow. D,D′) Ganglia in 4 dpf Ntr treated with 10 mM Met for 4 h. D) Dying cells (arrowheads) are apparent at this magnification (4000x). D′) Higher magnification of D (30,000x) shows a dying cell (electron-dense cell body with nucleus (Nuc) being engulfed by a phagocytic cell (arrows). |
|
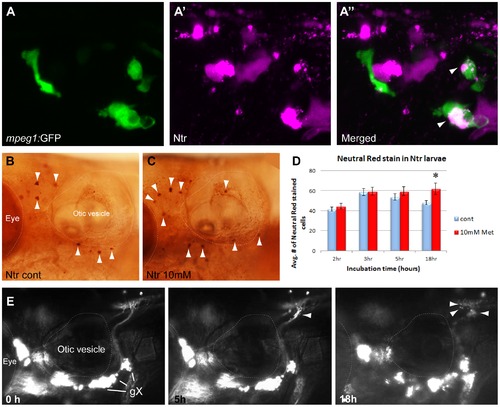
Macrophage response to degenerating neurons. A,A′,A′′) 5:gfp;Ntr larvae after a 24 hr treatment with 10 mM Met. A) Green channels shows macrophages located in a gX subganglion. A′) Magenta channel shows degenerating cell bodies. A′′) Merged image shows colocalization (white/pink) of debris with macrophages. B,C) Neutral Red (NR) stained macrophages (arrowheads) in B) untreated or C) 3 hr Met-treated Ntr larvae at 4 dpf. D) Quantitation of NR-stained cells in 4 dpf Ntr treated with fish water (control) or 10 mM Met for various times. Graph shows average number of NR-stained cells per treatment group at 2 h (control 41.53±2.13 cells, n = 15 and Met 44.65±2.82 cells, n = 17, ns), 3 h (control 58.7±3.48 cells, n = 10 and Met 59.45±4.01 cells, n = 11, ns), 5 h (control 53.83±3.38 cells, n = 11 and Met 59.42±4.43 cells, n = 12, ns), and 18 h (control 48.00±2.24 cells, n = 18 and Met 61.86±5.85 cells, n = 14, p<0.05) Only overnight Met treatment showed a significant increase in NR staining. E) Select images from a time-lapse video of 4 dpf panther;Ntr in 10 mM Met for 18 hrs. Puncta are seen along the axons at 5 h and 18 h (arrowheads). No other motile cells are seen surrounding the axons or ganglia. For all panels, anterior is to the left; dorsal is at the top. Eye and otic vesicle (OV) are outlined. Vagal ganglia labeled gX in panel E. |
|
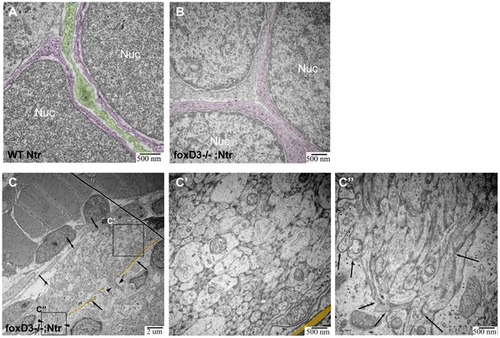
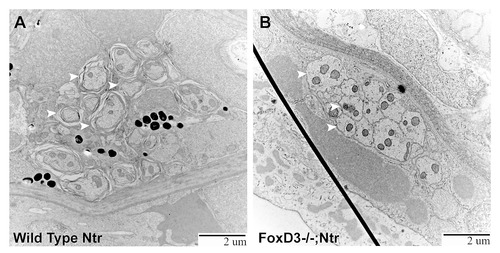
TEM images of missing peripheral glia in FoxD3-/-Ntr. A) Ganglion in 4 dpf wild type Ntr (40,000x) shows two cell bodies (nuclei, labeled Nuc; cytoplasm in magenta) with satellite glia (green) located in between. B) Ganglion in 4 dpf FoxD3-/-Ntr (30,000x) shows three adjacent cell bodies (nuclei in orange; cytoplasm in magenta) without satellite glia present. C,C′,C′′) Axons in 4 dpf FoxD3-/-;Ntr. C) Cross section of axon bundle (arrows) and longitudinal view of axons entering hindbrain (arrowheads) (7500x). Basement membrane indicated in orange in all images. C′) Higher magnification (30,000x) of axon bundle. Medium small axons appear relatively normal (compare to wild-type Ntr in Figure 4C′). C′′) Higher magnification (30,000x) shows defasciculated axons (arrows) entering brain (compare to Figure 4C′′). PHENOTYPE:
|
|
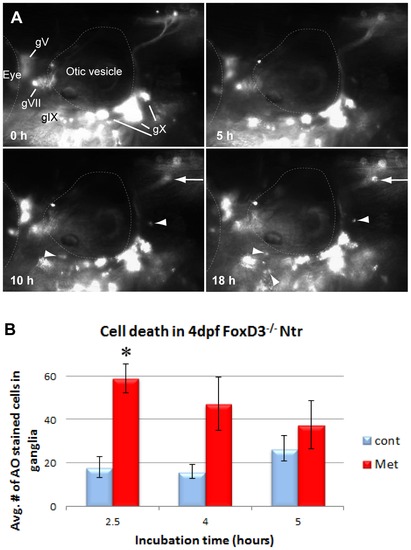
Inflammatory response in the absence of peripheral glia. A) Select images from a time lapse video of 4 dpf FoxD3-/-;Ntr treated with 10 mM Met for 18 h. Puncta around plexus (arrows) and red motile cells (arrowheads) appeared around 10 h after start of Met treatment. For comparison, wild type Ntr larvae developed puncta after 2?4 hr in Met (Figure 1B′). B) Quantitation of cell death in 4 dpf Met-treated FoxD3-/-Ntr compared to untreated FoxD3-/-;Ntr. AO-stained cell counts after various incubation times in 10 mM Met. There was a significant increase in cell death after 2.5 hour Met incubation (control 18.00±4.96, n = 9 and Met 59.06±6.66, n = 16, p<0.05), but not after 4 h (control 16.0±3.1 cells, n = 5 and Met 47.3±12.3, n = 6, ns) or 5 h (control 26.6±6.0 cells, n = 5 and Met 37.6±11.0, n = 5, ns) Met treatment. For all panels, anterior is to the left; dorsal is at the top. Eye and otic vesicle (OV) are outlined. Cranial ganglia labeled gV, gVII, gIX and gX in panel A. |
|
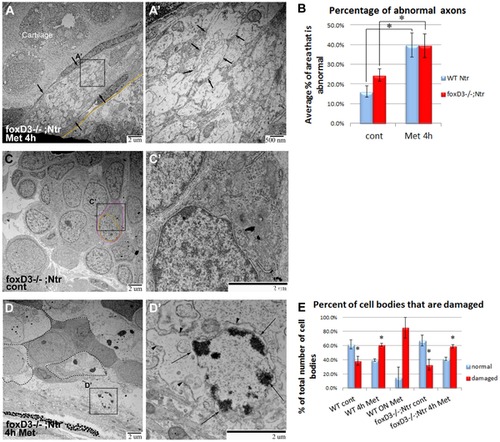
TEM images of axons and ganglia in 4/Ntr larvae. A,A′) Axons after 4) Cross section of axon bundle (arrows) (7500x). Membrane dividing brain and periphery (basement membrane) highlighted orange in all images. A′) Higher magnification (30,000x) of A. Individual axons (arrows) have abnormal appearance and broken membranes (compare to Figures 7C′ and 4D′). B) Quantitation of axon damage (given as percent of total axon area damaged) in Ntr and FoxD3-/-;Ntr. Damage in Ntr significantly increased from 16.2% (±2.84%, n = 10) in untreated to 39.9% (±6.08%, n = 5) with 4 hr Met treatment (p<0.01). In mutants, damage increased significantly from 24.53% (±3.19%, n = 7) in untreated to 39.48% (±5.97%, n = 3) in 4 hr Met-treated larvae (p<0.01). C,C′) Ganglia in untreated FoxD3-/-;Ntr (nucleus in orange; cytoplasm in magenta). C) Ganglia appear normal at low magnification (7500x) (nucleus in orange; cytoplasm in magenta; compare to Figure 5A). C′) Higher magnification (15,000x) shows normal cell body without surrounding glia. D,D′) Ganglia in FoxD3-/-;Ntr treated with 10 mM Met for 4 hr. D) Damaged cell bodies (outlined) are apparent at this magnification (7500x). D′) Higher magnification (15,000x) of degenerating cell. Nucleus has distinctive chromatin clumps (arrows). Cytoplasm contains damaged organelles and broken, irregular cell membranes (arrowheads, compare to Figure 5B′). E) Quantitation of Met-induced cell body damage in wild type Ntr and FoxD3-/-Ntr. Graph shows percent of normal versus damaged soma in wild type control (normal 61.7%±6.5%; damaged 38.3%±6.5%, n = 5, p<0.05), 4 h Met (normal 39.2%±2.0%; damaged 60.8%±2.0%, n = 5, p<0.05), 18 hr Met (normal 14.9%±14.9%; damaged 85.1%±14.9%, n = 2, ns), mutant control (normal 67.2%±7.8%; damaged 32.8%±7.8%, n = 2, p<0.05), and mutant 4 hr Met (normal 41.2%±2.5%; damaged 58.8%±2.5%, n = 3, p<0.05). Met treatment significantly increased the number of degenerating cells in wild type and mutant larvae after 4 hr Met treatment. |
|
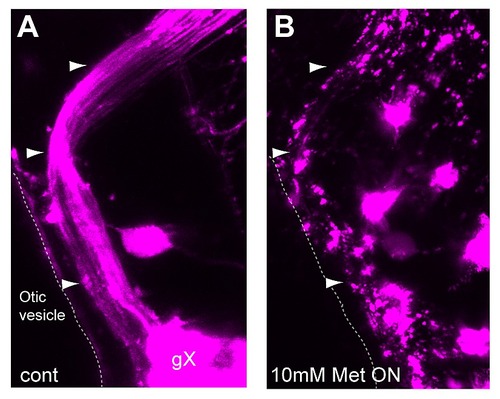
Complete ablation of Ntr-expressing peripheral sensory neurons after Met treatment. 4 dpf Ntr larvae treated with A) PTU water (control) or B) 10 mM Met for 18 hours. Confocal microscopy at 5 dpf revealed that vagal nerve axons (A, arrowheads) remain intact in control animals, but lose all structural integrity when treated overnight with Met (B). Anterior to left, dorsal at top. |
|
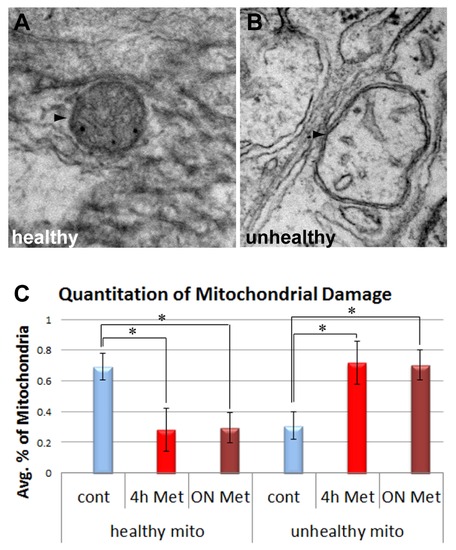
Met treatment increases mitochondrial damage in axons. TEM images show examples of healthy (A) and unhealthy (B) mitochondria (arrowheads) present in EM sections of control or treated vagal nerve bundles. Mitochondria were scored and the percentage of mitochondria found as healthy or unhealthy is shown in panel C (number of mitochondria evaluated: untreated controls, n = 82; 4 hr treatment n = 52, 18 hr treatment n = 88, number of fish examined per group ranged from 3?6). PHENOTYPE:
|
|
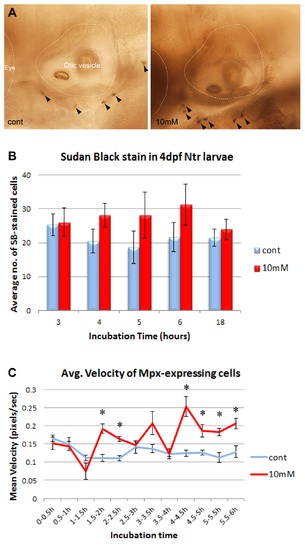
Neutrophil response to degenerating neurons in 4 dpf Ntr larvae. A) Sudan Black staining of Ntr treated with fish water (control) or 10 mM Met for 4 hr, (neutrophils labeled with arrowheads). B) SB-stained cell counts in larvae treated with control or 10 mM Met for various times. Average number of SB-stained cells/fish per treatment group shown for incubation times of 3 h (control 25.31±3.81, n = 16; Met 26.00±4.19, n = 17), 4 h (control 20.47±3.55, n = 17; Met 28.12±3.49, n = 17), 5 h (control 18.67±4.84, n = 6; Met 28.17±6.79, n = 6), 6 h (control 21.67±4.36, n = 6; Met 31.17±6.06, n = 6), and 18 h (control 21.55±2.55, n = 11; Met 23.92±2.95, n = 12). None were statistically significant. C) Neutrophil movement in Mpx:gfp;Ntr larvae treated with fish water or 10 mM Met. Graph shows average velocity (pixels/sec) of neutrophils over time: 0?0.5 h (control 0.165±0.008, n = 44; Met 0.152±0.017, n = 42, ns), 0.5?1 h (control 0.149±0.018, n = 15; Met 0.144±0.013, n = 32, ns), 1?1.5 h (control 0.112±0.007, n = 19; Met 0.075±0.023, n = 4, ns), 1.5?2 h (control 0.111±0.010, n = 17; Met 0.192±0.012, n = 93, p<0.05), 2?2.5 h (control 0.110±0.007, n = 51; Met 0.164±0.006, n = 64, p<0.05), 2.5?3 h (control 0.141±0.017, n = 23; Met 0.147±0.009, n = 50, ns), 3?3.5 h (control 0.137±0.011, n = 24; Met 0.207±0.032, n = 53, ns), 3.5?4 h (control 0.122±0.005, n = 51; Met 0.123±0.013, n = 24, ns), 4?4.5 h (control 0.124±0.008, n = 51; Met 0.253±0.027, n = 91, p<0.05), 4.5?5 h (control 0.126±0.006, n = 44; Met 0.187±0.017, n = 33, p<0.05), 5?5.5 h (control 0.113±0.014, n = 24; Met 0.183±0.010, n = 60, p<0.05), and 5.5?6 h (control 0.129±0.017, n = 30; Met 0.206±0.015, n = 36, p<0.05). Anterior is to the left; dorsal is at the top in all panels. Eye and otic vesicle (OV) are outlined. |
|
TEM images of posterior lateral line nerve in wild type and foxD3-/-;Ntr larvae. A) Cross section of the posterior lateral line nerve (pLL) in 4 dpf wild type Ntr (15,000x) shows axons surrounded by myelin (arrowheads). B) pLL in 4 dpf foxD3-/-;Ntr (15,000x) shows axons with adjacent axonal membranes (arrowheads). No myelin is seen. |
|
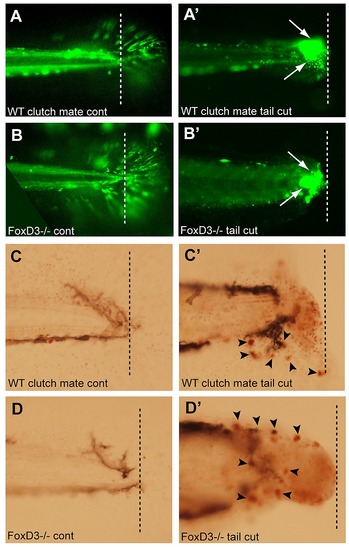
Loss of foxD3 does not result in an impaired immune response. Tail transections were performed on 4 dpf foxD3-/-;mpx:gfp or WT clutch mates. Larvae were anesthetized with tricaine and tails were transected with a scalpel at the junction of the body and tail fin. 2 hr after the tail transection, larvae were either imaged for GFP+ cells (mpx:gfp, neutrophils) or stained with NR to visualize macrophages. A) Uncut tail of WT clutch mate shows the location of the tail transection (dashed line in all images). A′) Transection site of WT clutch mate showed an increase in neutrophils at the location of the cut. B) Uncut tail of foxD3-/-;mpx:gfp shows location of tail transection. B′) Transected tail of foxD3-/-;mpx:gfp also showed an increase in neutrophils at the location of the cut (arrow), similar to that seen in WT clutch mates. C) Neutral Red staining in uncut tail of WT clutch mate. C′) NR staining at transection of WT clutch mate (arrow) showed an increase in macrophages at the location of the cut. D) NR staining at the transection site in a foxD3-/-;mpx:gfp larva. D′) NR staining of transection site in a foxD3-/-;mpx:gfp showed an increase in macrophages at the location of the transection (arrow), similar to that seen in WT clutch mates. |

